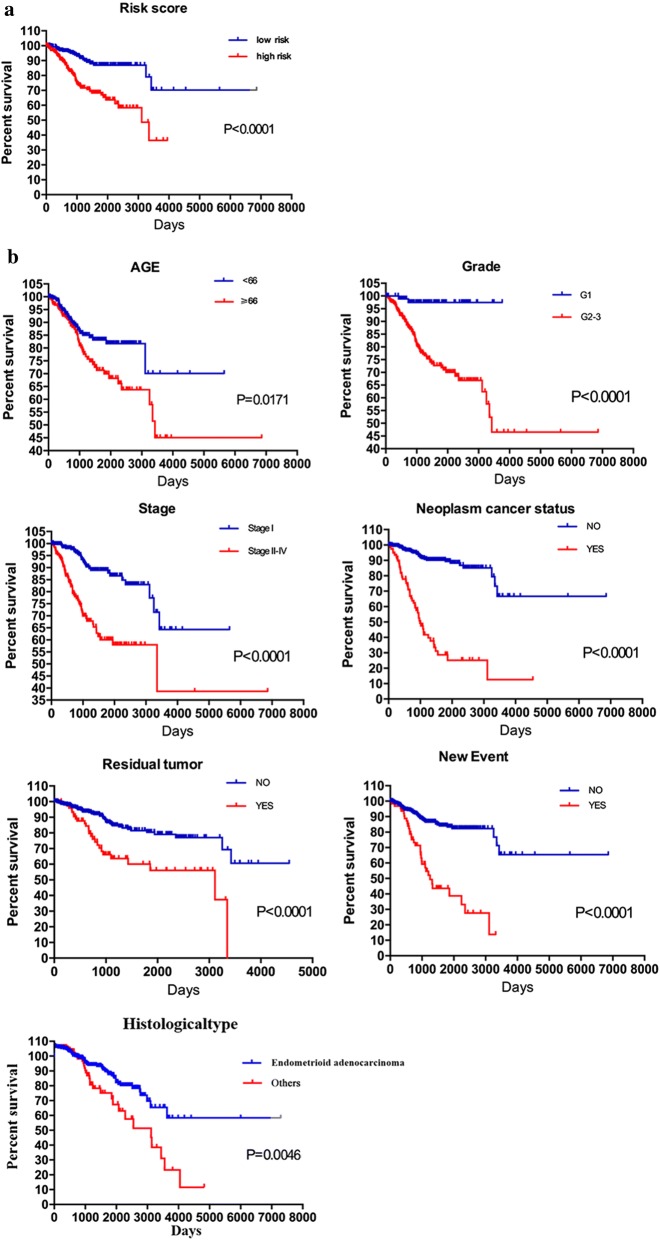
Fig. 5.
Kaplan–Meier survival analysis for EC patients in TCGA data set. a K–M survival curve for EC patients with high/low risk. b Clinical features including age, grade, stage, neoplasm cancer status, residual tumor and new event predict patients survival. c histological type predict patients survival

