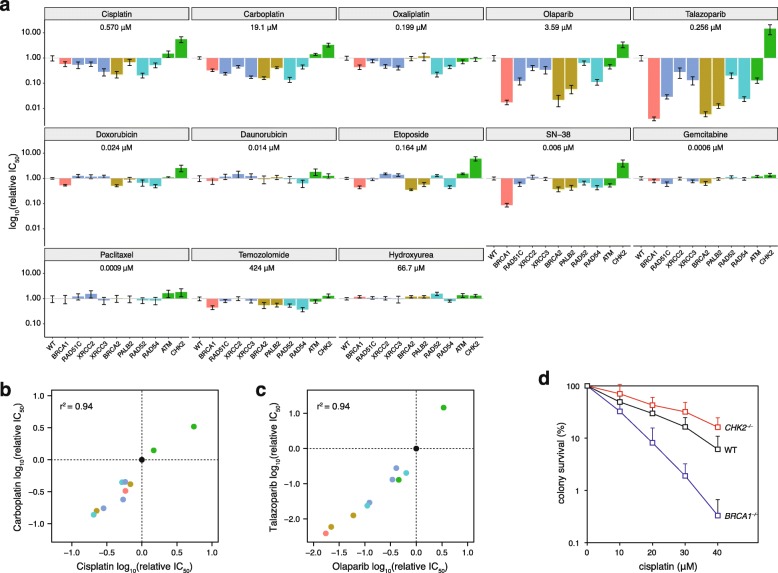
Fig. 5.
Sensitivity of HR-deficient cell lines to cytotoxic agents. a Results of cytotoxicity measurements shown as the fold difference in sensitivity to the indicated drugs of each mutant cell line as compared to the wild type. The mean relative IC50 values and SEM of three independent measurements are shown. The mean absolute IC50 value of the wild type line is shown for each drug. b, c Correlation of the relative IC50 values of cisplatin vs. carboplatin (b) and olaparib vs. talazoparib (c). Each marker represents a cell line, color coded as in a; the wild type is shown in black. The r2 value for simple linear regression is shown. d Colony survival assay following the treatment of the indicated cell lines with cisplatin for 1 h. The mean survival percentages and SEM of three independent measurements are shown

