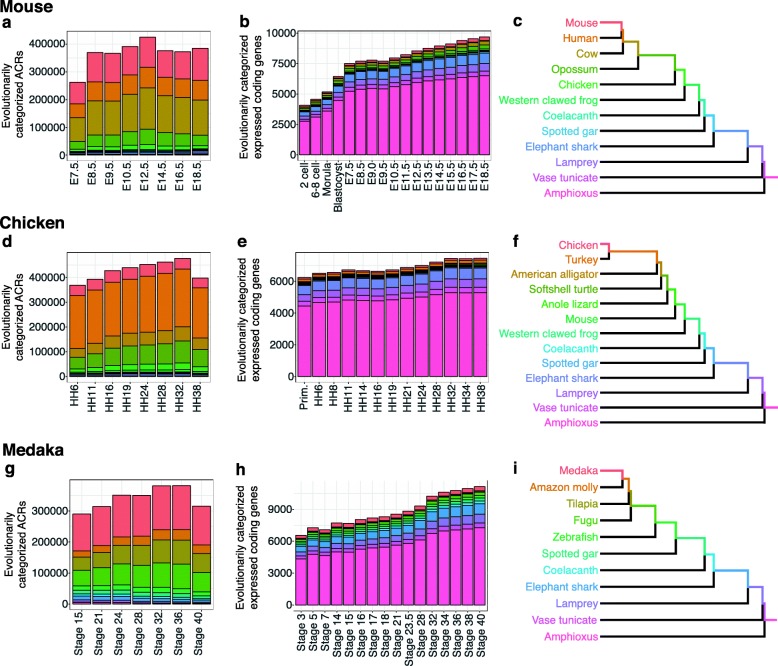
Fig. 2.
Numbers of ACRs and expressed protein-coding genes categorized according to evolutionary ages. Stacked bar graphs show the numbers of evolutionarily categorized ACRs (a, d, g) and expressed (FPKM > 1) protein-coding genes (b, e, h) at each developmental stage in mouse (a, b), chicken (d, e), and medaka (g, h). Evolutionary ages of ACRs were estimated based on Method I (for details, see Methods and Additional file 2: Figure S4). The evolutionary ages of protein-coding genes were estimated according to the most recent common ancestors of all the species sharing the homologs; the expressed genes that were estimated to be lost secondarily in any of the compared species were excluded (see Methods for details). Colors in each stacked bar graph indicate the categories of the evolutionary ages of each element. Each evolutionary category includes ACRs or expressed protein-coding genes that originated during the correspondingly colored period in the phylogenetic trees shown in c, f, and i

