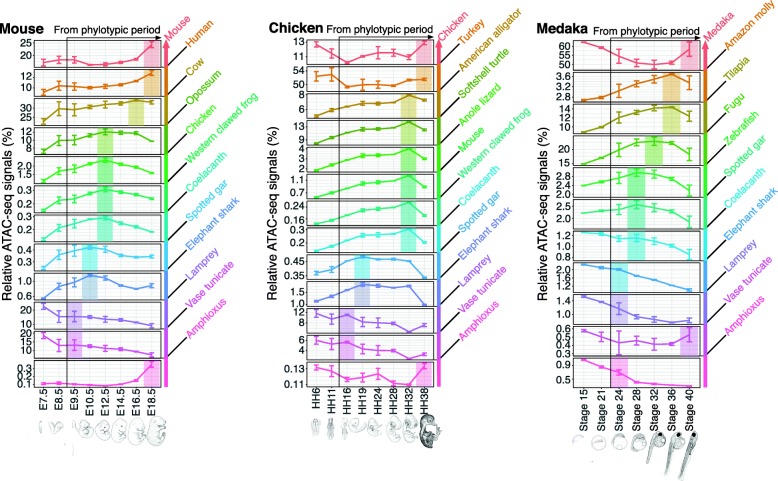
Fig. 3.
Transition of developmental stages with the maximum evolutionarily categorized chromatin accessibility during vertebrate embryogenesis. For each developmental stage in three vertebrate species (mouse, chicken, and medaka), the percentages on the vertical axis represent the summed signal intensity for each evolutionary category of ACRs divided by the total signal intensity for all categories (relative ATAC-seq signal). The color of each category indicates the estimated evolutionary age of the region (shown at right). In each graph, the developmental stages with the highest signal from the potential phylotypic period are highlighted in the corresponding colors, as is the range that showed a recapitulative pattern for unknown reasons. Error bars indicate the standard deviation of three biological replicates for each developmental stage. Changes in the relative ATAC-seq signals were statistically significant (Kruskal–Wallis rank sum test) in all cases, except for the vase tunicate category in medaka. Detailed statistical information is provided in Additional file 1: Table S7

