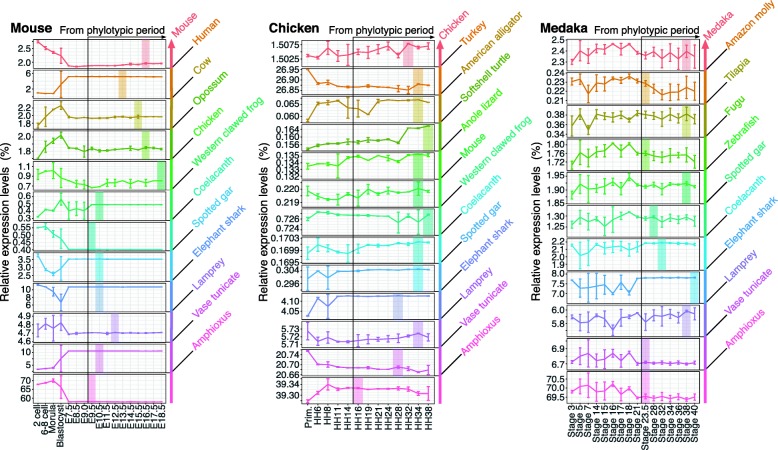
Fig. 4.
No recapitulative pattern was observed in developmental gene expression levels
For each developmental stage, summed expression levels of evolutionarily categorized protein-coding genes were shown as the percentage relative to the total expression levels of all evolutionary categories. The color of each category corresponds to the estimated evolutionary age of the protein-coding genes (shown at right). The evolutionary age of each protein-coding gene was estimated according to the most recent common ancestors of all the species sharing the homologs. Genes that were estimated to be secondarily lost in any of the compared species were excluded (see Methods for details). In each graph, developmental stages with the highest value after the potential phylotypic period are highlighted in the corresponding color. Error bars indicate the standard deviation of biological replicates for each developmental stage. Statistical information for the Kruskal–Wallis rank sum test is given in Additional file 1: Table S8.

