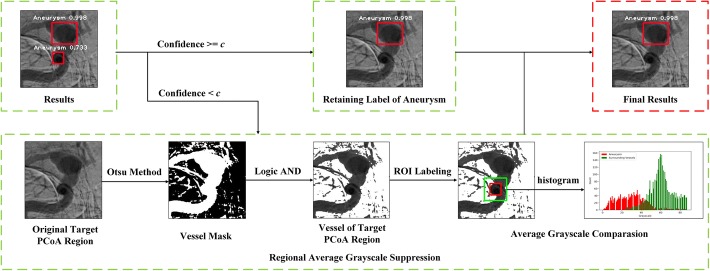
Fig. 4.
The flowchart of Regional Average Grayscale Suppression (RAGS) algorithm. In this figure, the red bounding box denoted aneurysm with the white annotation of region name and confidence in images of top raw. The pipeline of RAGS algorithm was displayed in bottom raw. In the rightest image, the red bounding box denoted ROI of aneurysm and the green bounding box denoted the ROI of enlargement area. And the histogram illustrated the difference of grayscale distribution between ROI of aneurysm (red bars) and ROI of enlargement area (green bars)

