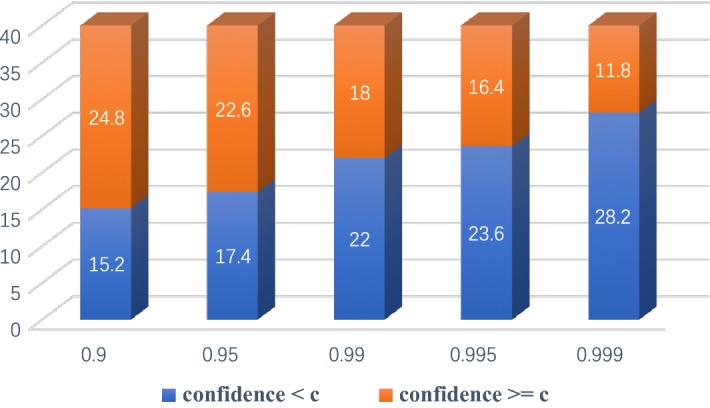
Fig. 5.

Distribution of patients for different choices of parameter c. The white annotations on bars were average count of patients. The orange part of bars denoted average count of patients whose disease confidence were equal or higher than c, and the blue part of bars meant average count of patients whose disease confidence was smaller than c
