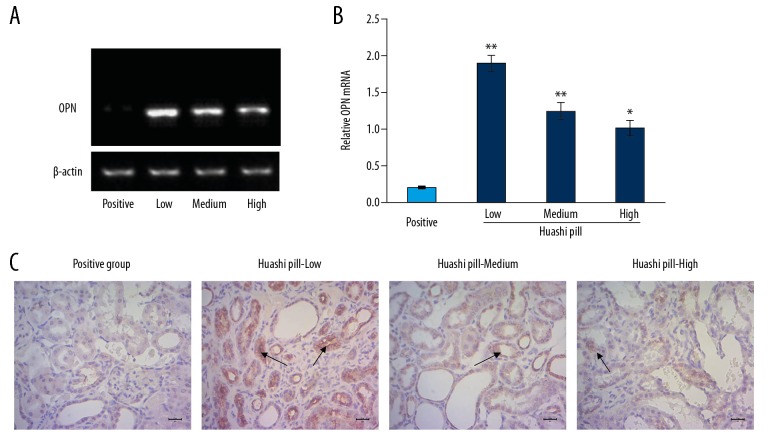
Figure 7.
Investigation for the osteopontin (OPN) expression by using real-time polymerase chain reaction assay and immunohistochemistry assay. (A) Images for the mRNAs. (B) Statistical analysis for the mRNA levels. (C) Immunohistochemistry assay for OPN expression. The black arrows represented the OPN staining positive cells.

