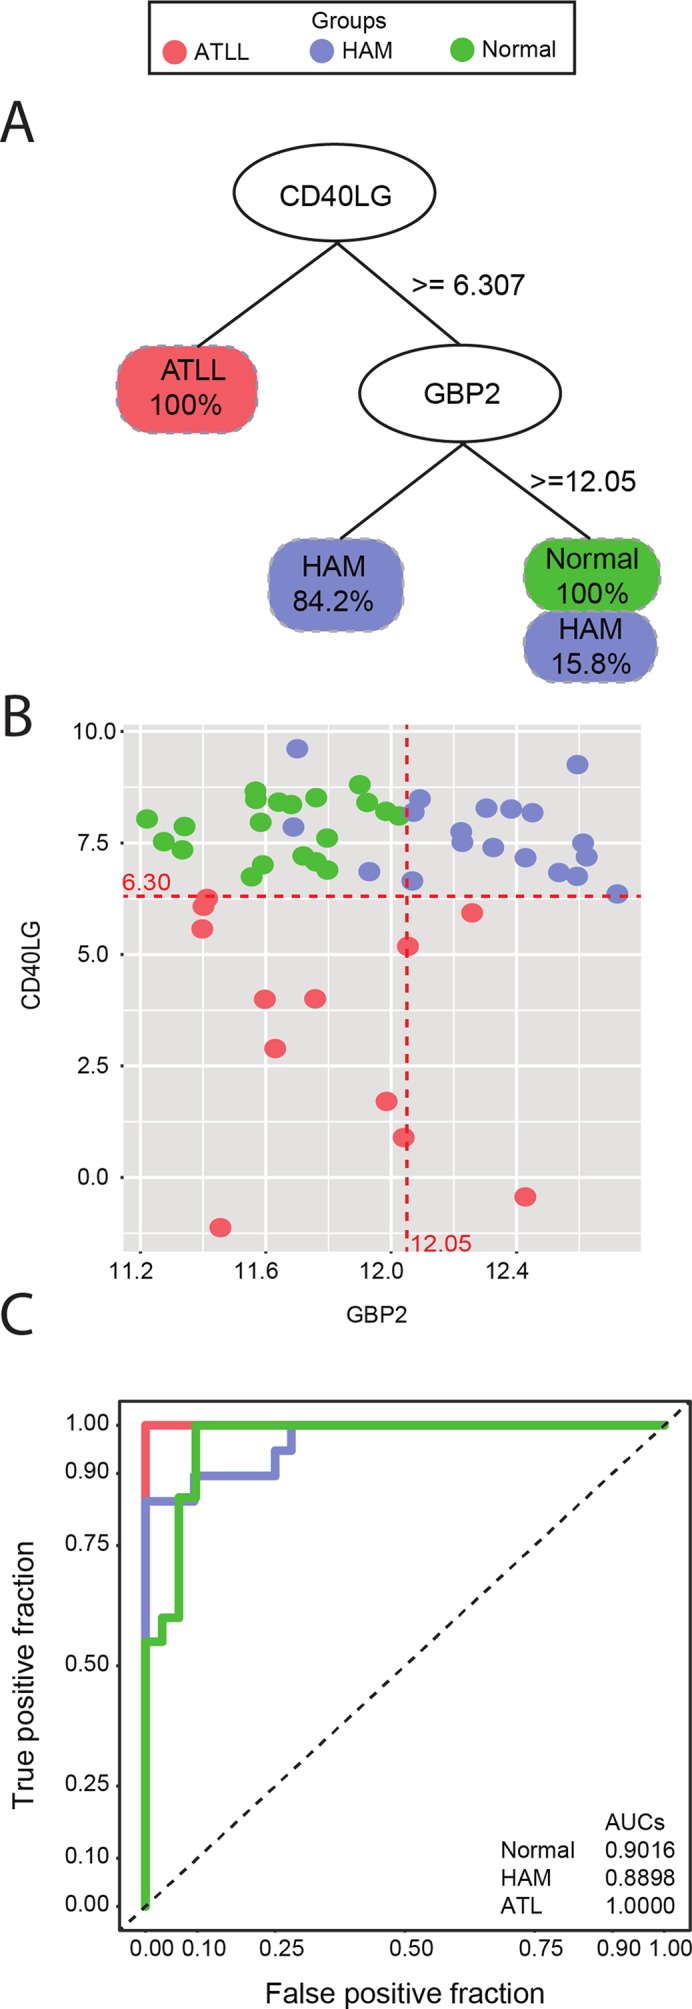
Figure 1.

(A) Decision tree classification of three different symptomatologies using CD40LG to separate all ATLL samples from the others, and GBP2 to separate 84.2% of the HAM/TSP samples from controls. (B) Scatterplot of CD40LG (Y axis) and GBP2 (X axis) gene expression detailing the dispersion of the analyzed samples. Red lines represent the thresholds suggested by decision tree analysis. (C) ROC curve representing accuracy. An AUC of 0.9016 was found for the control group, 0.8898 for the HAM/TSP group, and 1.000 for ATLL. The red line represents the ATLL group, blue indicates HAM/TSP, and green is indicative of controls.
