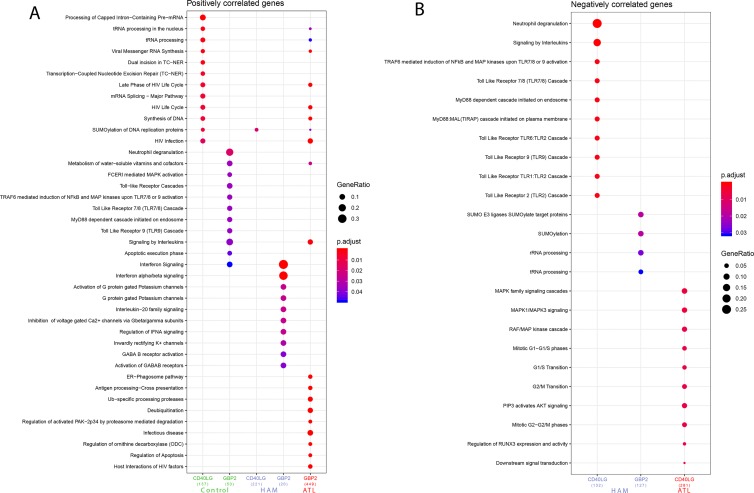
Figure 2.
(A) Pathways associated with genes found to be positively correlated with CD40LG and GBP2, grouped according to symptomatology. (B) Pathways associated with genes found to be negatively correlated with CD40LG and GBP2, grouped according to symptomatology. Analysis performed using the following parameters: p-value = 0.05, q-value = 0.2, minimum number of genes to cluster = 20, maximum number of genes to cluster = 500.

