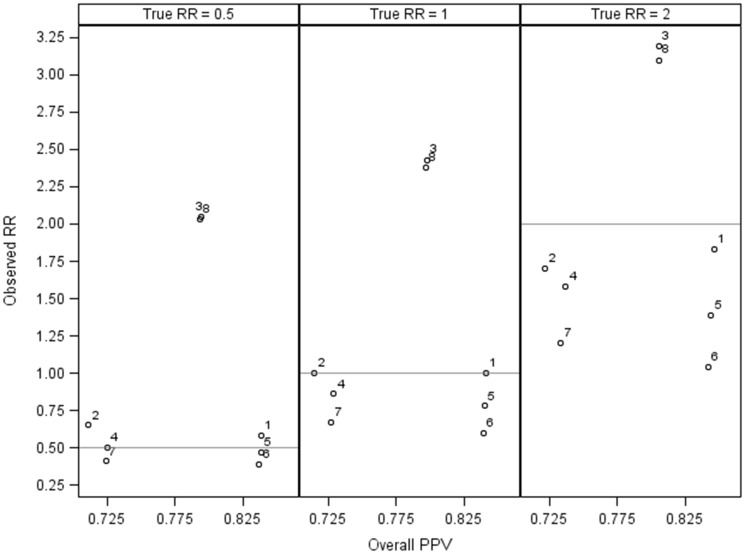
Figure 1.
Overall outcome positive predictive value (PPV) and observed relative risk (RR), without bias analysis, from 8 simulated scenarios of outcome misclassification. (1) nondifferential misclassification: overall outcome sensitivity (SN) = 95%, overall outcome specificity (SP) = 99%; (2) nondifferential misclassification: SN = 90%, SP = 98%; (3) differential specificity: outcome sensitivity among exposed (SN1) = 95%, outcome specificity among unexposed (SN0) = 95%, outcome specificity among exposed (SP1) = 90%, outcome sensitivity among unexposed (SP0) = 99%; (4) differential specificity: SN1 = 95%, SN0 = 95%, SP1 = 99%, SP0 = 98%; (5) differential sensitivity: SN1 = 70%, SN0 = 95%, SP1 = 99%; SP0 = 99%; (6) differential sensitivity: SN1 = 50%, SN0 = 95%, SP1 = 99%; SP0 = 99%; (7) differential specificity and sensitivity: SN1 = 70%; SN0 = 95%, SP1 = 99%; SP0 = 98%; and (8) differential specificity and sensitivity: SN1 = 90%; SN0 = 95%, SP1 = 90%; SP0 = 99%.

