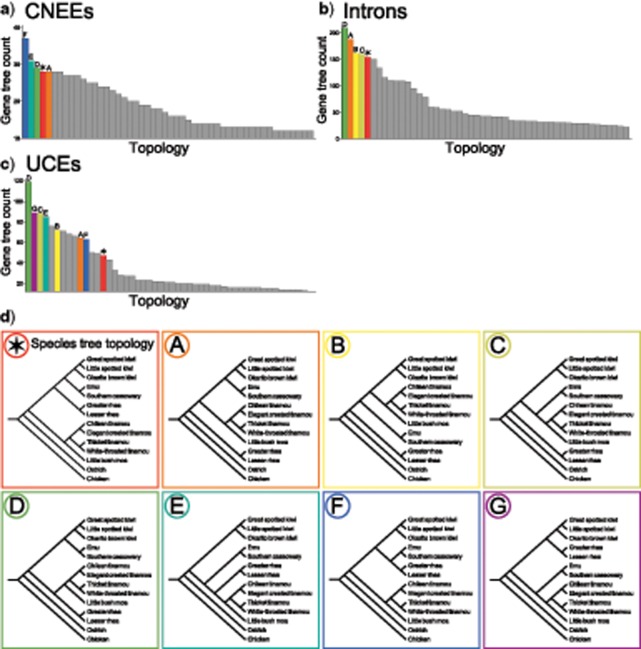
Figure 5.
Distributions of the 50 most common gene tree topologies for CNEEs (a), introns (b), and UCEs (c), showing that the most common gene tree topology for each marker type does not match the inferred species tree topology, which is marked with a star symbol. Symbols and bar coloring in parts a-c correspond to the topologies shown in (d) (e.g., the most common gene tree topology for CNEEs, colored in dark blue and marked “F” in the histogram in part a, corresponds to the topology shown in panel “F” of d).

