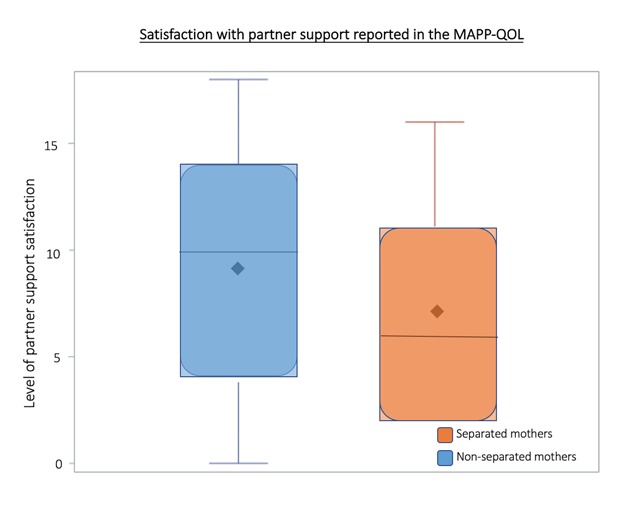
Figure 2.

MAPP-QOL Partner Support Satisfaction Distribution.
The shaded box represents the interquartile range (IQR), the range from the 25th percentile (Q1) to the 75th percentile (Q4). Median and mean are indicated by solid line and diamond, respectively. Horizontal lines indicate minimum and maximum values when they fall outside of the IQR.
A greater score indicates a greater feeling of satisfaction. The partner scores were found to have a large difference between separated and non-separated mothers in terms of the magnitude of effect reported when utilizing a wilcoxon rank sum test, with a p-value of <0.01. (Figure 1). Thus, lack of partner support is associated with maternal-child separation.
