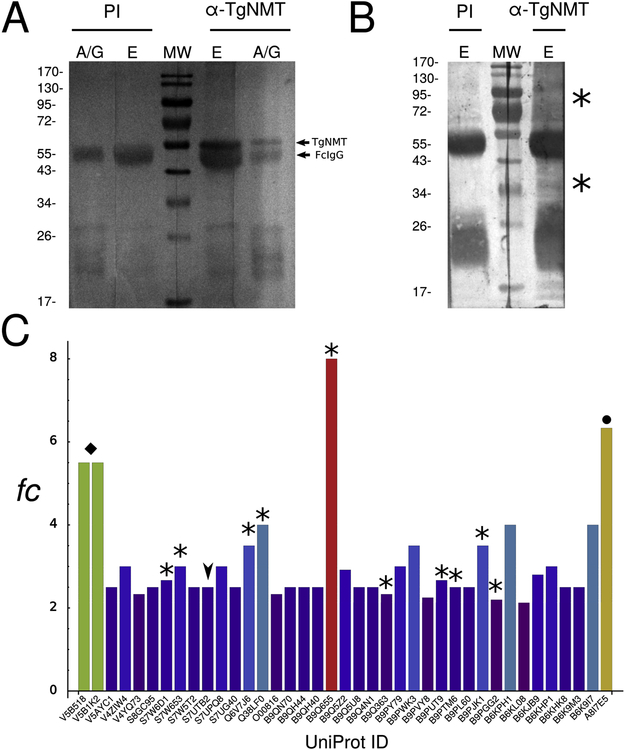
Figure 4. TgNMT interactome.
(A) Western blot analysis of T. gondii NMT immunoprecipitation with TgNMT antiserum (α-TgNMT). The pre-immune fraction (PI) was used as negative control. A/G: proteins bound to A/G sepharose beads even after elution; E: eluted proteins from with A/G sepharose; MW: molecular weight pattern. TgNMT migration is indicated with an arrowhead. (B) Ponceau red stain of Western blot described above. Asterisks indicate bands corresponding to potential TgNMT partners. (C) Bar chart of spectral count (SpC) for every protein detected in the MudPIT analysis. Only those proteins whose SpC fold change (fc) exceeded the value of 2 were plotted. Asterisks indicate proteins that participate in the translation process. Arrowheads indicate a predicted TgNMT substrate. A black diamond indicates proteins that participate in vesicular transport. A black circle indicates GRA7 antigen, a well-represented antigen in the total proteome.

