FIGURE 3:
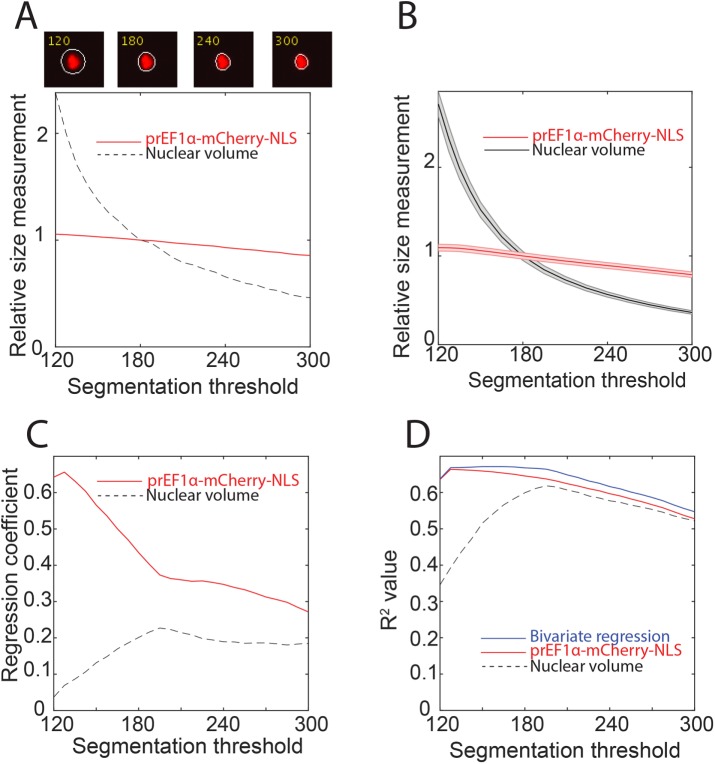
Sensitivity of nuclear volume and EF1α-mCherry-NLS to the segmentation threshold. (A) Top panels, a single nucleus segmented at four different intensity thresholds. Bottom panel, nuclear volume and total mCherry-NLS measurements for that cell at each threshold. Measurements were normalized to their value when the segmentation threshold is 180 (see Materials and Methods). (B) Mean and associated SE of nuclear volume and mCherry-NLS measurements for a cell population at different intensity thresholds. Measurements were normalized to the mean value when the segmentation threshold is 180. N = 379 cells. (C, D) Analysis of the correlation of nuclear volume and mCherry-NLS with CFSE total protein dye. Each measurement was normalized to its mean, and bivariate regression was performed using nuclear volume and mCherry-NLS as predictor variables, and using CFSE as the response variable. N = 303 cells. (C) Plot of the regression coefficient (i.e., slope) for each predictor variable as a function of segmentation threshold in a bivariate regression indicating that mCherry-NLS contributes more to predicting CFSE. (D) Plot of the coefficient of determination as a function of segmentation threshold for the bivariate regression alongside the coefficient of determination for each single variable regression.

