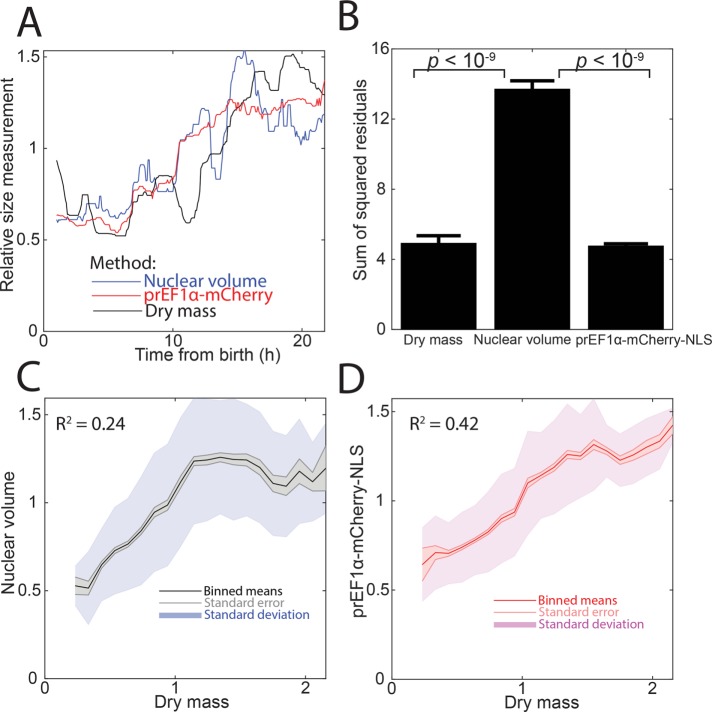
FIGURE 5:
Comparison of nuclear volume, mCherry-NLS, and dry mass measurements. Dry mass was measured by quantitative phase microscopy (see Materials and Methods). (A) Representative trace of a single cell tracked through time. Each measurement type was normalized to its median. (B) Plot of an error metric: the mean and SE of the sum of squared residuals from a piecewise linear fit, as in Figure 4, C and D. N = 8 cells. (C, D) Correlation of nuclear volume or mCherry-NLS with cell dry mass. Binned means, SE of the mean, and SD of the data are shown. N > 2000 measurements.

