FIGURE 2:
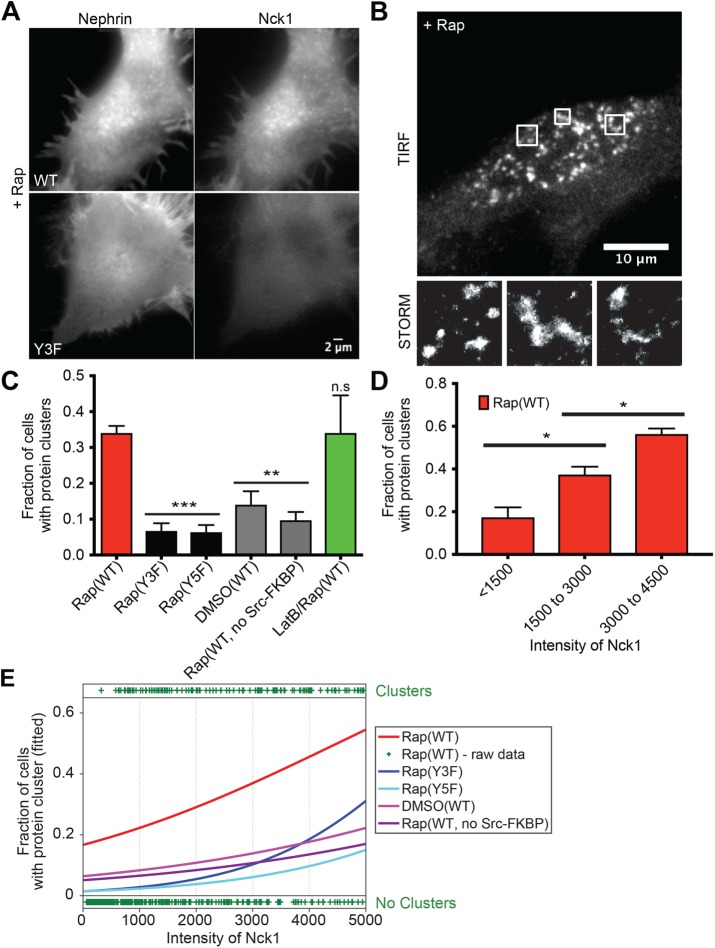
Nephrin/Nck1 cluster formation at the basal membrane is dependent on interactions between nephrin and Nck1 as well as cellular concentration of Nck1. (A) TIRF images of live HeLa cells expressing Src-FKBP, nephrin-FRB (left column), and Nck1 (right column). Cells expressed either nephrin(WT)-FRB (top row) or nephrin(Y3F)-FRB (bottom row). Both images were taken from cells treated with 10 min of MβCD followed by 30 min of rapamycin. (B) TIRF-STORM images of a fixed HeLa cell expressing Src-FKBP, nephrin-FRB (shown in images), and Nck1. Cells were fixed after 10 min of MβCD and 30 min of rapamycin treatment. Zoomed images from three boxed regions of the top image are shown in the bottom row. (C–E) Quantitative analyses of protein clustering in various experimental conditions and at different cellular concentrations of Nck1. TIRF images of nephrin and epi/TIRF images of Nck1 from fixed HeLa cells were used for the analyses. Cells expressed Src-FKBP (unless noted as “no Src-FKBP”), Nck1, and nephrin(WT, Y3F, or Y5F)-FRB as indicated. Cells were treated with 10 min of MβCD and 30 min of rapamycin (Rap), 30 min of DMSO (DMSO), or 10 min of LatB followed by 20 min of rapamycin (LatB/Rap) (N = 3 independent experiments, each with >140 cell images). For C and D, error bars represent SEM (*p < 0.05; **p < 0.01; ***p < 0.001). (C) Graph showing the fraction of cells with clusters over various experimental conditions. (D) Graph showing the fraction of cells with clusters for different cytoplasmic expression levels (assessed by epifluorescence intensity measurements) of Nck1. (E) Graphs showing the fitted probability of a cell forming clusters at a given Nck1 fluorescence intensity level in the cytoplasm. Curves show data for each condition—binary cell responses (y = 1 or 0 for a cell containing or lacking clusters, respectively) and Nck1 intensity values—fitted with a logistic regression to estimate the probability of cells producing clusters at a given Nck1 intensity level (lines, left axis). Raw data from the “Rap(WT)” sample are shown as an example with plus signs at the top or bottom of the image, indicating a single cell containing or lacking clusters, respectively, at the indicated Nck1 intensity.

