FIGURE 3:
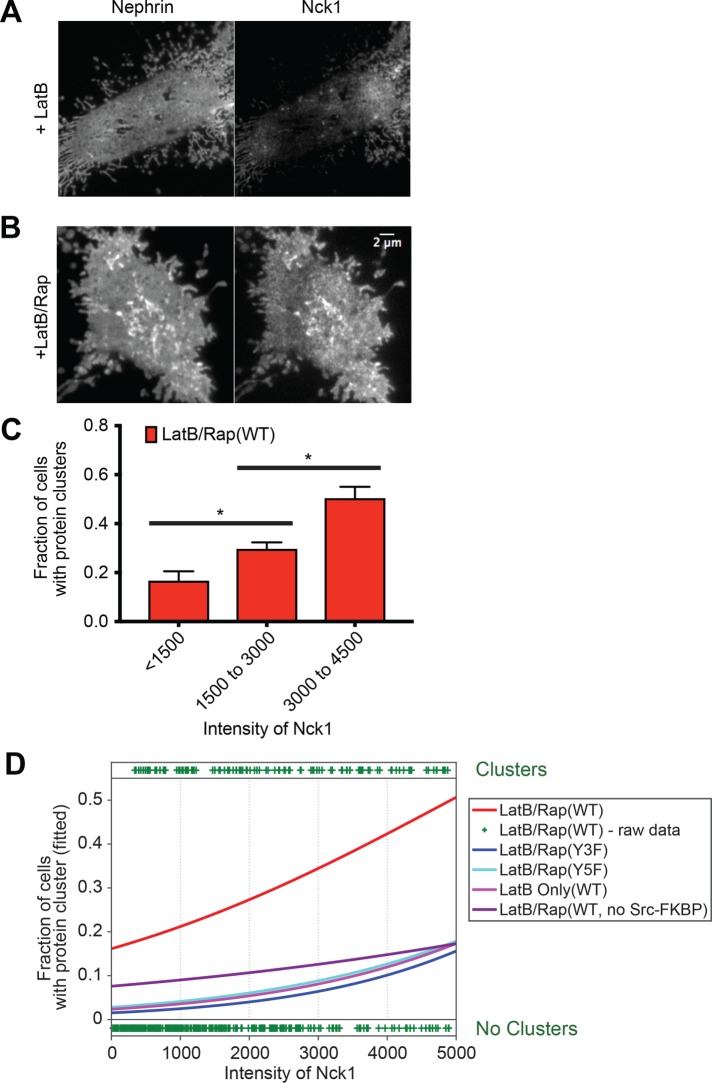
Nephrin/Nck1 clusters form independently of actin polymerization. (A, B) TIRF images of a fixed HeLa cell expressing Src-FKBP (unpublished data), nephrin-FRB (left), and Nck1 (right). (A) Cells were treated for 10 min of MβCD followed by 30 min with LatB prior to fixation. (B) Cells were treated for 10 min of MβCD and 15 min of LatB followed by 15 min of rapamycin prior to fixation. (C, D) Quantitative analyses of protein clustering vs. cellular concentration of Nck1. TIRF images of nephrin and epi/TIRF images of Nck1 from fixed HeLa cells were used for the analysis. Cells expressed Src-FKBP (unless noted as “no Src-FKBP”), Nck1, and nephrin (WT, Y3F, or Y5F as indicated)-FRB. Data labeled “LatB Only” were from cells treated with 10 min of MβCD followed by 30 min of latrunculin. All other data (LatB/Rap) are from cells treated with 10 min of MβCD, 15 min of LatB and 15 min of rapamycin prior to fixation (N = 3 independent experiments, each with >140 cell images). (C) Graph showing the fraction of cells with clusters for different cytoplasmic expression levels (assessed by epifluorescence intensity measurements) of Nck1. Error bars, SEM (*p < 0.05). (D) Graphs showing the fitted probability of a cell forming clusters at a given Nck1 intensity level in cytoplasm. Cell data for each condition were fitted (lines) with a logistic regression model (left axis). Each plus sign indicates the status (containing or lacking clusters) of a single cell from “LatB/Rap(WT)” sample (right axis).

