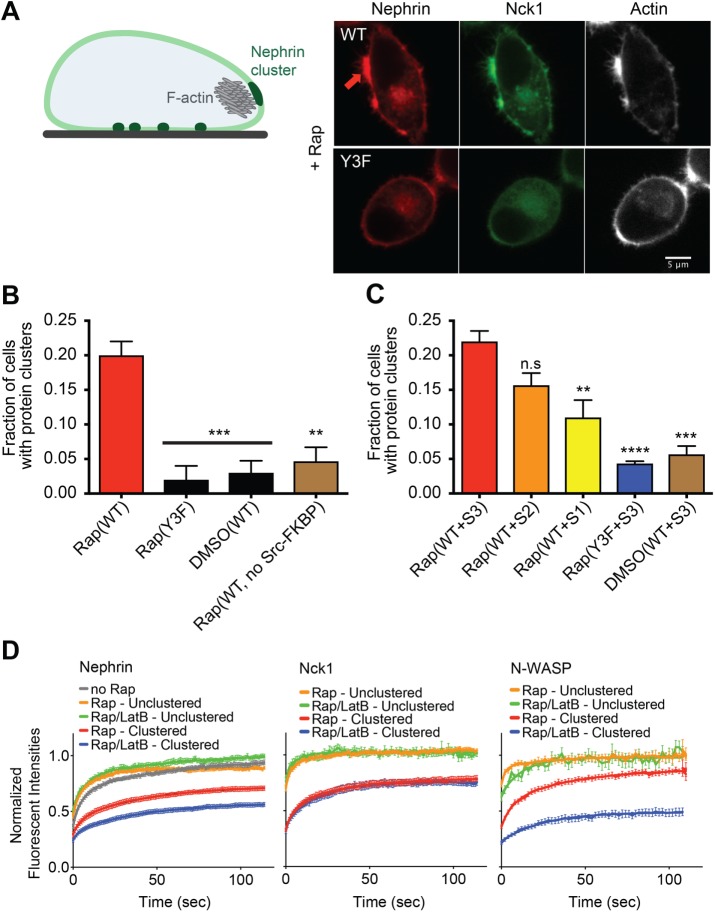
FIGURE 6:
Nephrin/Nck1 clusters at the periphery of cells form with dense actin structures. (A) Left: cartoon illustrating a HeLa cell with nephrin clusters at the basal membrane (dark green regions at bottom of the cell) and at the periphery (large dark green region at the cell side) enriched with F-actin structure (gray mesh). Right: spinning disk confocal images from fixed Hela cells expressing Src-FKBP, nephrin(WT, top row; Y3F, bottom row)-FRB (red), and Nck1 (green). Cell samples were treated with 10 min of MβCD followed by 10 min of rapamycin. Fixed-cell samples were stained for F-actin using A647-phalloidin (right column, white). (B) Graph showing the fraction of cells with clusters expressing a subset of Src-FKBP (unless noted as “no Src-FKBP”), nephrin(WT or Y3F as indicated)-FRB, and Nck1. Spinning disk confocal images from fixed-cell samples were used for the analysis. Cells were treated with 10 min of MβCD followed by either 10 min of rapamycin (Rap) or 10 min of DMSO (DMSO). Error bars, SEM N = 3 independent experiments, each with >25 cell images (**p < 0.01, ***p < 0.001). (C) Graph showing the fraction of cells with clusters expressing a subset of Src-FKBP, nephrin(WT or Y3F as indicated)-FRB, and one of the engineered Nck proteins, S3, S2, or S1. Spinning disk confocal images from fixed-cell samples were used for the analysis. Cells were treated with 10 min of MβCD followed by either 10 min of rapamycin (Rap) or 10 min of DMSO (DMSO). Error bars, SEM N = 3 independent experiments, each with >20 cell images. (**p < 0.01, ***p < 0.001, ****p < 0.0001). (D) FRAP of nephrin (left), Nck1 (middle), or N-WASP (right) at the periphery of a cell in either clustered regions (red and blue) or unclustered region (orange and green). FRAP experiments were performed with live cells expressing Src-FKBP, nephrin-FRB, and Nck1 with (right) or without (left) N-WASP. Cells were treated with 10 min of MβCD followed by either 10 min of rapamycin (Rap) or 10 min of rapamycin and 10 min of LatB (Rap/LatB). Recovery of nephrin-FRB, Nck1, or N-WASP intensity in the bleached region was imaged every 1 s for 120 s. Error bars, SEM N > 25 cells analyzed for nephrin. N ≥ 14 cells analyzed for Nck1 and N-WASP.

