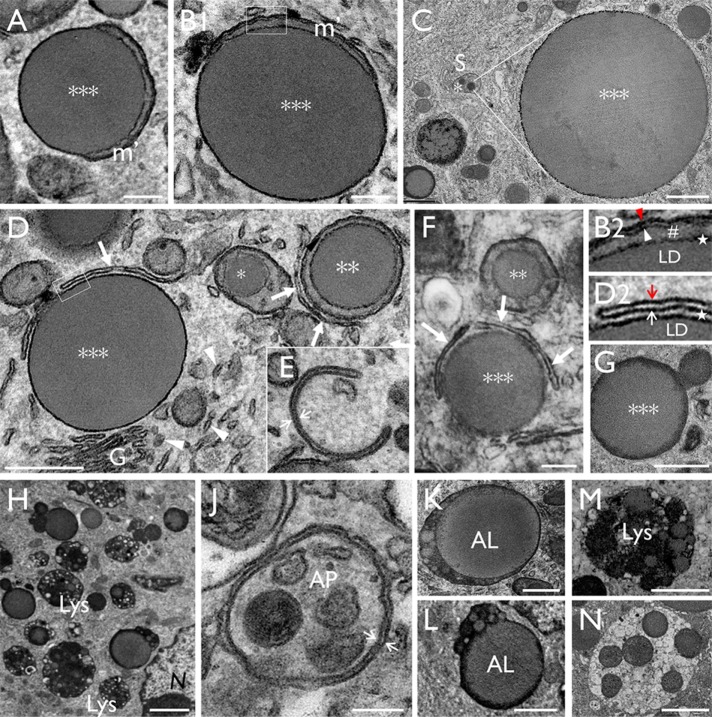
FIGURE 5:
Urothelial LDs are degraded via the autophagy-lysosome pathway. (A–C) The continued expansion of mitochondrial LDs led to partially denuded (A, B) or completely denuded (C) LDs (***; stage III). Note in C the relative size difference between a newly formed stage I (*) intramitochondrial LD (0.2–0.4 μm) and a giant stage III denuded LD (4–5 μm). (D) Close proximity between the mitochondrial LDs with ER (arrowheads), Golgi (G), and autophagosomal membranes (arrows). B2 and D2 show the higher-magnification views of the boxed areas in B and D, respectively; the star in B2 highlights the intimate association between LD and its surrounding mitochondria, and that in D2 highlights the variable space between LD and the autophagosomal membrane. The red and white arrowhead/arrow in B2 and D2 denote the outer and inner membranes of the mitochondria and isolation membranes, respectively. (E) An autophagosomal “isolation membrane” (white arrows). (F) A large LD (***) partially surrounded by isolation membranes. (G) Possible fusion/fission of LDs. (H) The close proximity of large LDs with lysosomes. (J) A presumed autophagosome (AP) enclosing LD-containing mitochondria. (K, L) Two large LDs fusing with lysosomes forming autophagosomes/autolipophagosomes (ALs). (M, N) A lysosome and a possible secondary lysosome, respectively. Scale bars = 0.2 µm in A, B, E, F, and J; 0.5 µm in D1 and K; 1 µm in C, E, G, L, and M; and 2 µm in H and N.

