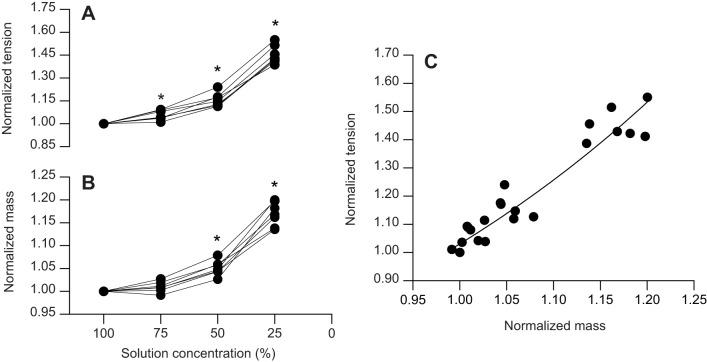
Fig. 1.
The effect of solutions of varying tonicity on bullfrog semimembranosus muscle tension and mass (n=7). (A) Passive tension (recorded at 1.15L0) and (B) muscle mass increased as solution concentration was reduced. Lines between points connect data from individual muscles. Asterisks denote a significant difference from baseline mass or tension. (C) Muscle tension and mass are correlated over a physiologically realistic range of volume changes, and their relationship is well described by the equation f(x)=e(a+bx), which also describes passive muscle tension as a function of length (Otten, 1987).

