Fig. 3.

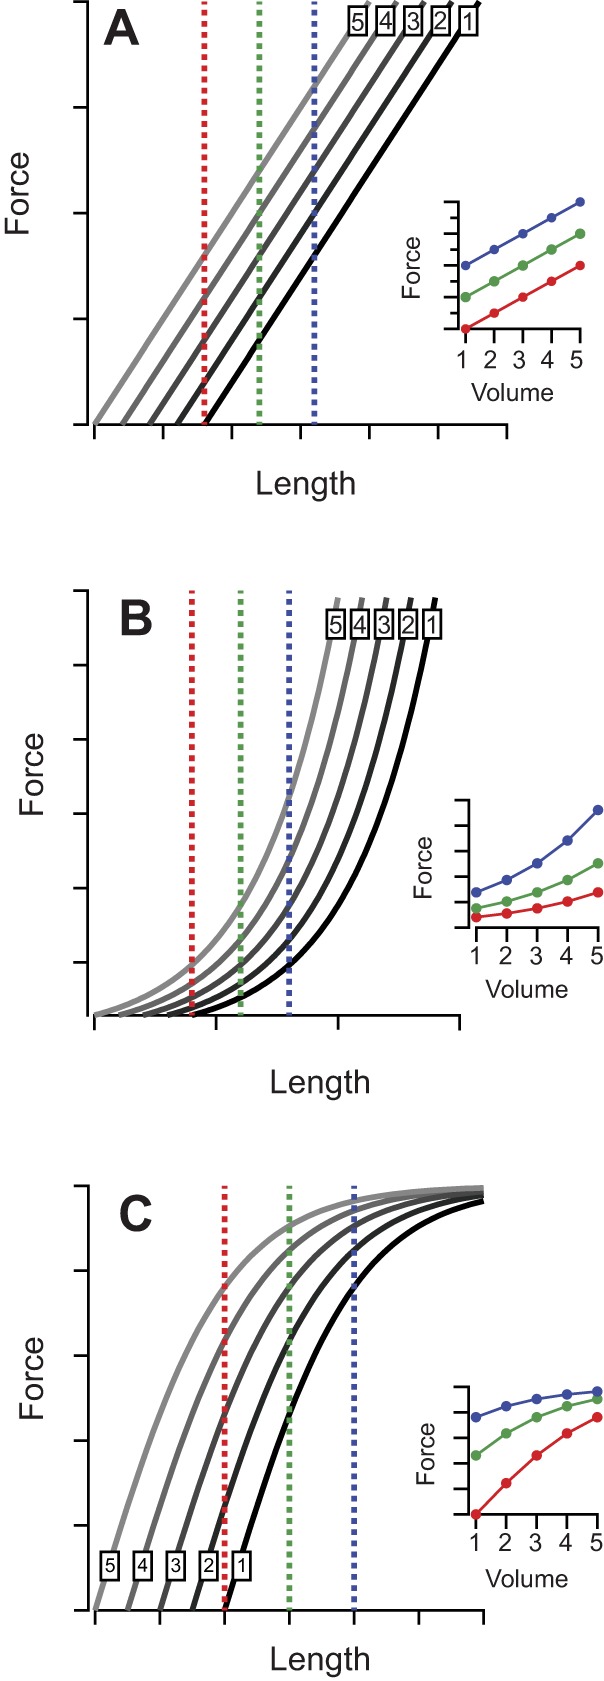
Conceptual figure (arbitrary units) illustrating similarity between shapes of force–length and force–volume curves. Three simulated force–length profiles are presented: (A) linear, (B) exponential and (C) asymptotic. In each, volume increases are simulated by duplicating an initial curve (volume 1) and replotting at a series of incremental lengths along the x-axis (volumes 2–5). For each profile, force is sampled at three arbitrary lengths (red, green and blue dashed lines) and replotted as a function of volume (insets). The resulting force–volume curves match the profiles of the force–length curves from which they were sampled. Linear force–length curves produce linear force–volume curves, exponential force–length curves produce exponential force–volume curves, and asymptotic force–length curves produce asymptotic force–volume curves.
