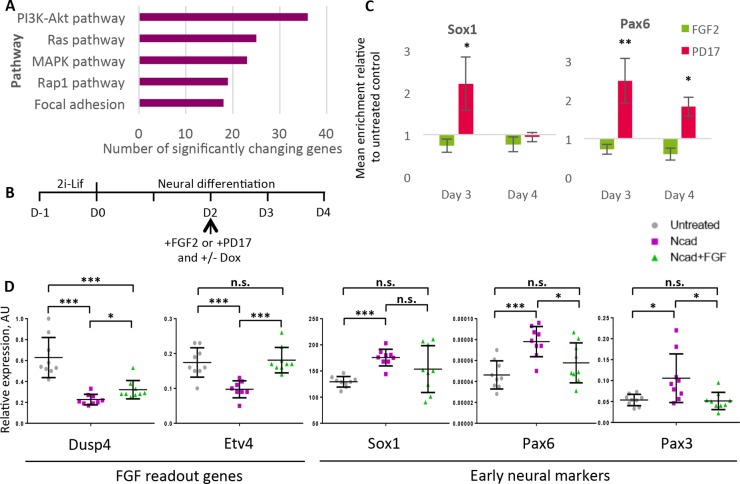
Fig. 5.
Cadherin switching promotes neural differentiation by dampening FGF signalling. (A) Top five signalling pathways most affected by N-cadherin overexpression 48 post-induction compared with un-induced control. Data generated by DAVID functional annotation of Nanostring mRNA expression values. 142 genes out of 770 genes tested changed significantly. (B) Protocol for FGF modulation experiments in inducible N-cadherin overexpressing cell lines. (C) qPCR analysis in WT cells with FGF2 or PD173074 (PD17). n=3 biological replicates, error bars represent s.e.m. *P≤0.05, **P≤0.01 compared with untreated control, unpaired Student's t-test. (D) qPCR analysis of gene expression after 48 h of N-cadherin induction. n=9, error bars represent s.d., *P≤0.05, ***P≤0.001, unpaired Student's t-test. n.s., no significance.

