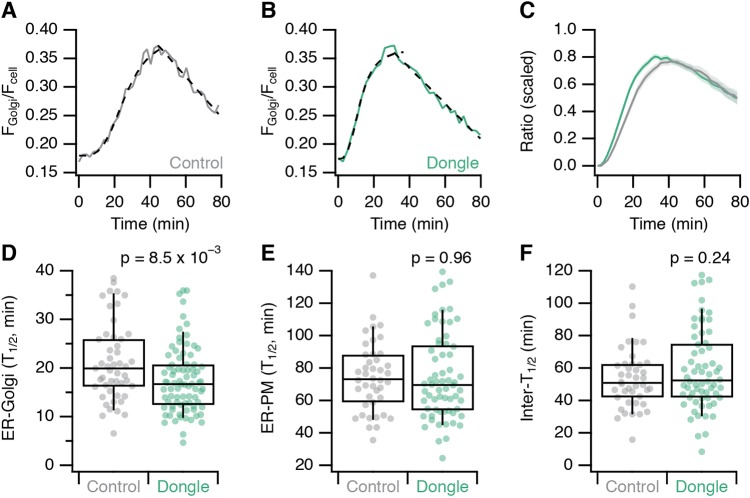
Fig. 6.
Effect of dongle expression on anterograde in GFP–TPD54 knock-in HeLa cells. (A,B) Example trace of the E-cadherin fluorescence ratio following RUSH recorded from (A) a control (MitoTrap-expressing, gray) or (B) a dongle (3×FKBP dongle-expressing, green) GFP–TPD54 knock-in HeLa cell. Traces fitted with a logistic function and a line. (C) Scaled fraction of total E-cadherin fluorescence at the Golgi as a function of time, in control (gray) or dongle-expressing (green) cells. Line and shaded area represent mean±s.e.m. (D–F) Box plots showing the half-times of E-cadherin transport from (D) ER-to-Golgi and (E) ER-to-PM in control and dongle-expressing GFP–TPD54 knock-in cells. (F) The difference in half-times represents intra-Golgi transport. Box represents the IQR, the line the median and the whiskers the 9th and 91st percentile. P-values from Student's t-test with Welch's correction. ncell=49–82, nexp=3.

