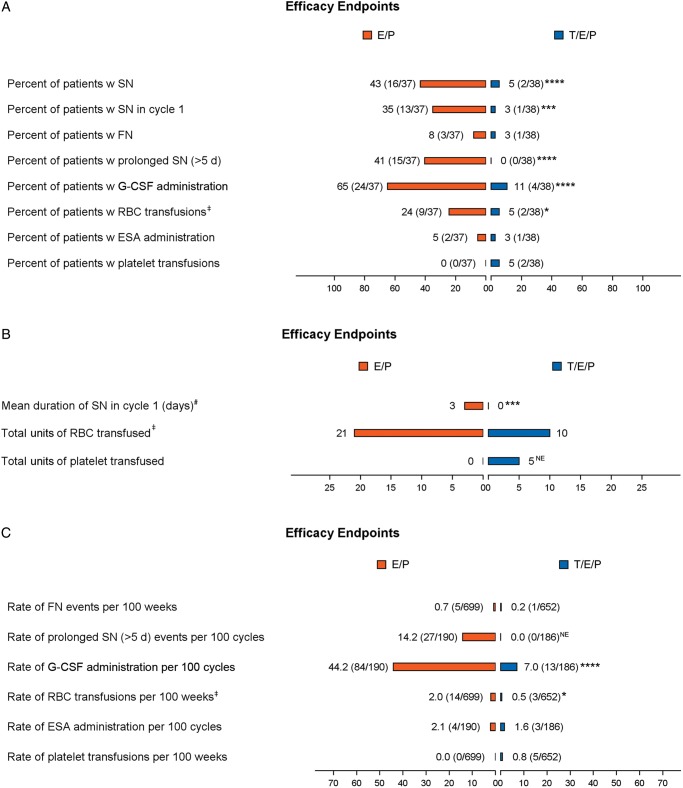
Figure 1.
Myelosuppression end points. Assessment of myelosuppression end points across hematological lineages. (A) Occurrence of specified end point per treatment group represented as percent (number of patients with at least one event/total number of patients per group). (B) Summary of the duration of SN in cycle 1 and the total units of RBCs or platelets transfused per treatment group. (C) Number of episodes of specified end point reported as event rate per 100 weeks or 100 cycles (number of events/cumulative number of weeks or cycles). Statistical significance: * ≤0.05, ** ≤0.01, *** ≤0.001, **** ≤0.0001. NE, not estimable; orange, E/P + Placebo (E/P); blue, E/P + Trilaciclib 240 mg/m2 (T/E/P); SN, severe (grade 4) neutropenia; FN, febrile neutropenia; RBC, red blood cell; ESA, erythropoietin-stimulating agent; G-CSF, granulocyte-colony stimulating factor; d, day; w, with. ‡Analysis only includes RBC transfusions on/after 5 weeks of treatment. #Mean duration of SN in cycle 1 per treatment group (including patients without an event, whose duration is 0 days).

