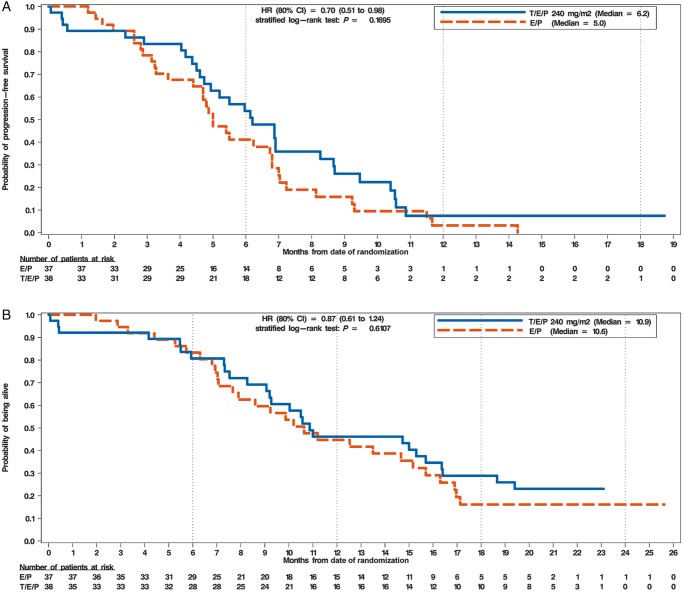
Figure 4.
Progression-free and overall survival. (A) Kaplan–Meier analysis of progression-free survival. The x-axis depicts months from first dose of study drug administration and number of patients at risk. The y-axis depicts the probability of being progression-free. (B) Kaplan–Meier analysis of overall survival. The x-axis depicts months from first dose of study drug administration and number of patients at risk. The y-axis depicts the probability of being alive. The HR and its 80% CI are calculated using the Cox regression model and the P-value is calculated using the stratified log-rank method. Baseline ECOG status (0-1 versus 2) was used as the stratification factor for both the HR and P-value calculations. orange, E/P + Placebo (E/P); blue, E/P + Trilaciclib 240 mg/m2 (T/E/P); HR, hazard ratio; CI, confidence interval; mg, milligram; m2, meter squared.

