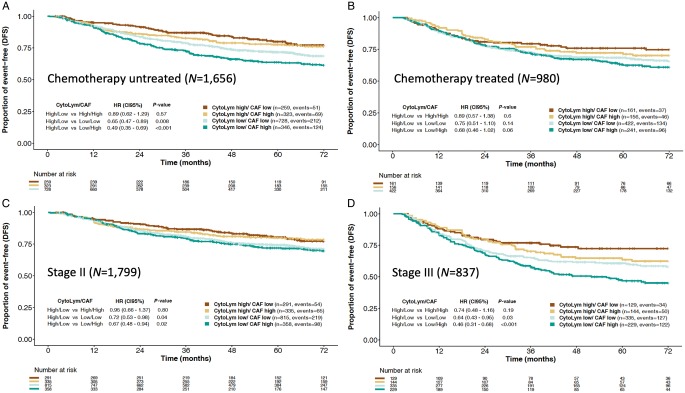
Figure 1.
Adjusted disease-free survival (DFS) Kaplan−Meier curves stratified by CytoLym and CAF groups, estimated with multivariable Cox proportional hazard model controlling for pT, pN, age, sex, primary tumor location, MSI status and CMS4 scores:chemotherapy untreated (A), chemotherapy treated (B), stage II (C) and stage III (D) CRC cohorts.

