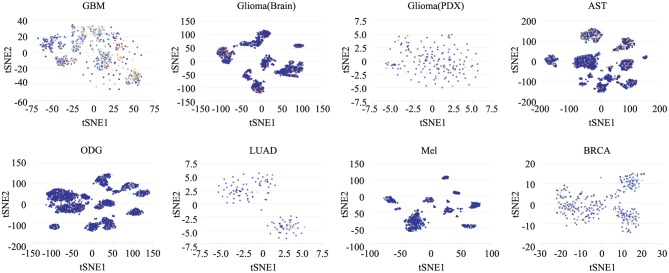
Figure 5.
The distribution of heterogeneous cell groups. Tridimensional t-SNE representation of cell clusters in primary tumors after classic multidimensional scaling and dimensionality reduction. Every point represents a single cell, and the color of the point represents the expression level of the gene (gene list) in the cell. Glioblastoma (GBM), Glioma (Brain), Glioma (PDX), Astrocytoma (AST), Oligodendroglioma (ODG), Lung adenocarcinoma (LUAD), Melanoma (MEL), and Breast cancer (BRCA).

