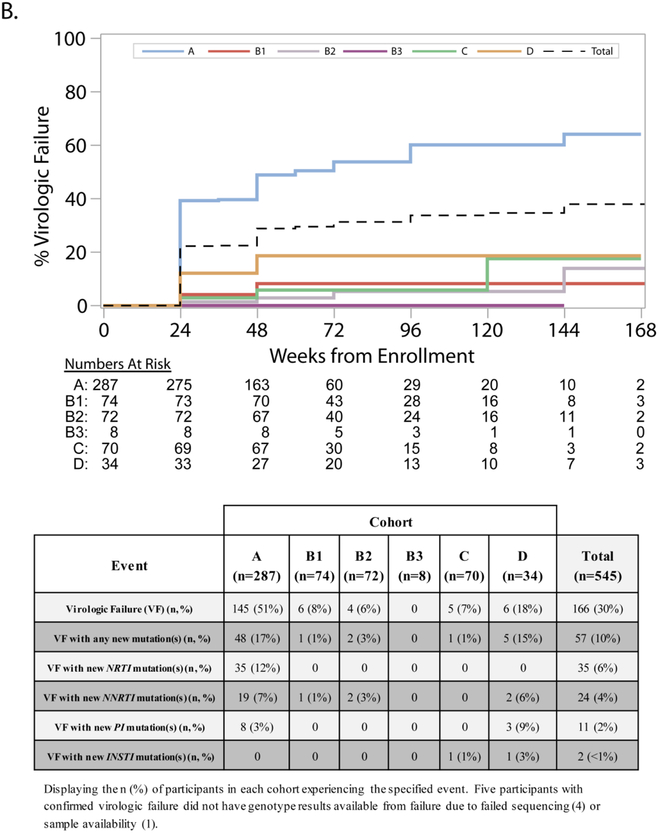
FIGURE 4-. PANEL ‘B’– Cumulative incidence of virologic failure and accompanying table displaying development of resistance associated mutations.
Shown are the cumulative percentage of participants who experienced confirmed virologic failure over time. At-risk numbers for each cohort and time point are displayed. For participants who did not experience confirmed virologic failure (including those who died), censoring was at the last HIV-1 RNA measurement on or before the end of follow up. Virologic failure was defined as two consecutive HIV-1 RNA values greater than or equal to 1000 copies/mL at or after 24 weeks on study. Evaluations for virologic failure included in the analysis occurred on or after 22 weeks (specifically, on or after 154 days from study entry) to allow for the scheduled visit window for the week 24 visit. The identification of new resistance-associated mutations was defined as the development of a mutation, not present at screening, identified and scored by the Stanford HIVDB 6.2 algorithm. Changes in mixture mutations were not counted as new mutations. Participants indicated as having developed new mutations may have lost mutations present at screening.

