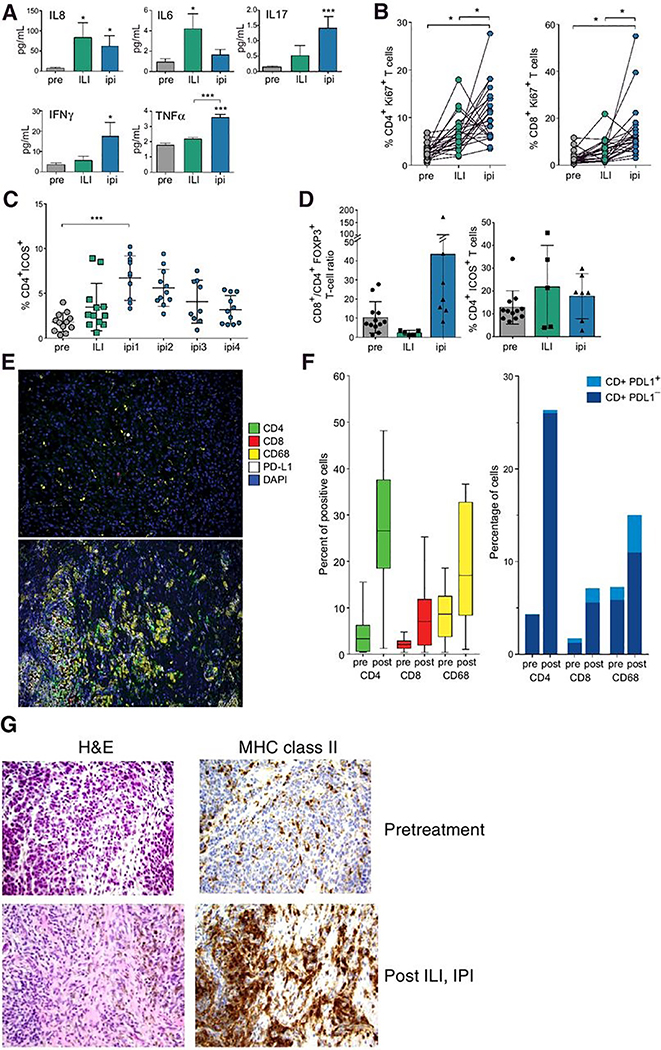
Fig. 4.
Analysis of cytokines and immune cell phenotypes in the phase II trial. (A) Increase in serum cytokines after combination therapy. The cytokines indicated were quantitated by Meso Scale Discovery assay in serum taken pretreatment (pre), after isolated limb infusion (ILI), and after the initial ipilimumab (ipi) treatment. *, P < 0.05; ***, P < 0.001 compared with pretreatment or as indicated by brackets. Note the increase in cytotoxic cytokines after combination treatment consistent with nanostring data (B-D) Changes in T cells in blood and tumor after ILI and ipilimumab treatments, assessed by flow cytometry. (B) Increase in percentage of CD4+ Ki67+ and CD8+ Ki67+ T cells, of total CD45+ cells, in peripheral blood mononuclear cells after ILI and after the first dose of ipilimumab. (C) Increase in percentage of CD4+ ICOS+ cells after ILI and after the each of the first (of 4) ipilimumab doses. (D) Analysis of tumor samples demonstrating an increase in the ratio of CD8+ T cells to CD4+FOXP3+ T cells (left) and the percentage of CD4+ICOS+ T cells (right). The bars shown mean values and standard deviation. (E,F) Immune infiltration in tumors after isolated limb infusion and ipilimumab treatment. (E) Representative multiplex immunohistochemistry at 20x showing CD4 (green), CD8 (red), CD68 (yellow), and PD-L1 (white) on samples of a tumor before treatment (top) and after isolated limb infusion and ipilimumab (bottom). (F) Quantitation of the immunohistochemical results from all available tumors. Note the increase in CD4+, CD8+, and CD68+ cells. Left, box-and-whisker plot showing the median, interquartile range, and range (excluding outliers) for cells positive for CD4, CD8, and CD68. Right, mean percentage of positive cells, with dark green indicating the PD-L1-positive subset. G) H&E and immunohistochemistry of a single tumor, demonstrating the pretreatment melanoma tumor cells with a paucity of immune cells but with MHC II expression (top), and an increase in both immune cells and MHC after ILI and IPI (bottom).

