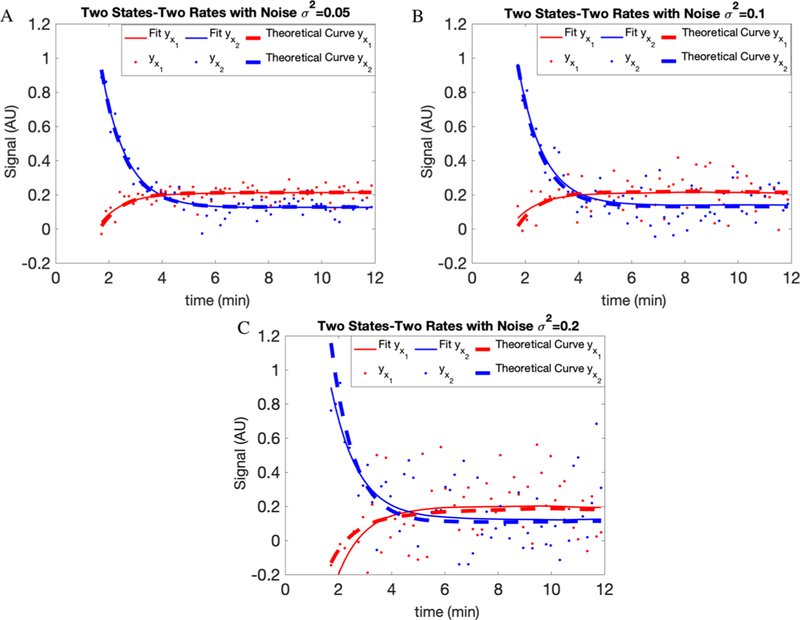
Figure 2.
Fits for the synthetic model shown in Figure 1. For each compartment, the results are shown after adding white noise with variances of (A) 0.05, (B) 0.1, and (C) 0.2. The dots are generated data points, the dashed lines are theoretical curves, and the solid lines are the fits on our data. AU here stands for arbitrary units.

