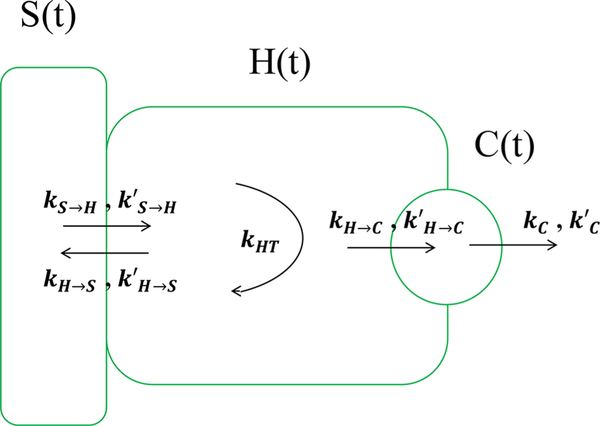
Figure 5.
Schematic of hepatic transport model used. We consider five transport rates for fluorescein: kS → H for the transport from the sinusoid to the hepatocyte, kH → S from the hepatocyte back to the sinusoid, kH → C from the hepatocyte to the canaliculus, and a loss rate kC from the canaliculus. We also assume glucuronidated fluorescein is transported via the same mechanisms, albeit with rates that have different values, designated by the primed symbols above. Finally, kHT represents the transformation of fluorescein into its glucuronidated form within the hepatocyte. The arrows show the direction of flow.

