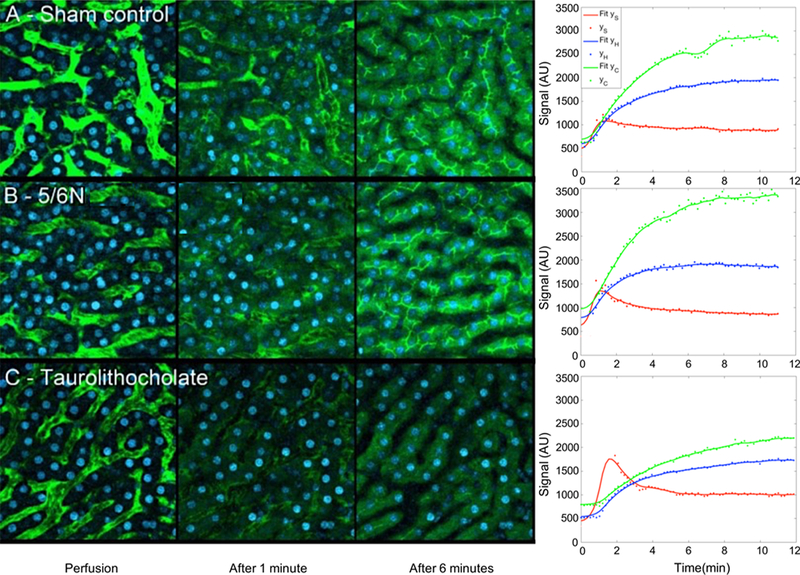
Figure 6.
Results of studies of fluorescein transport in rat model sham control, 5/6N, and taurolithocholate (TLC)-treated Livers. (A) We have sample images from a set of collected images from the liver of a rat as the sham control (without removing the kidneys) during intravenous injection of sodium fluorescein. On the right-hand side, we see our method’s fit to the data with kinetic parameters responsible for the fit reported in Table 4. (B) We show results for a 5/6N rat model in which the kidneys were removed. The main difference between (A) and (B) is the change in the rate of hepatic uptake of fluorescein as quantified by the rates from the sinusoid to the hepatocyte between the sham control and 5/6N rats for both glucuronidated and unglucuronidated forms of fluorescein. More details on the rat model are provided in ref 29. (C)We show example images collected from a rat treated by the agent TLC obtained after intravenous injection. The TLC highly reduces the rate of fluorescein uptake into the canaliculus.

