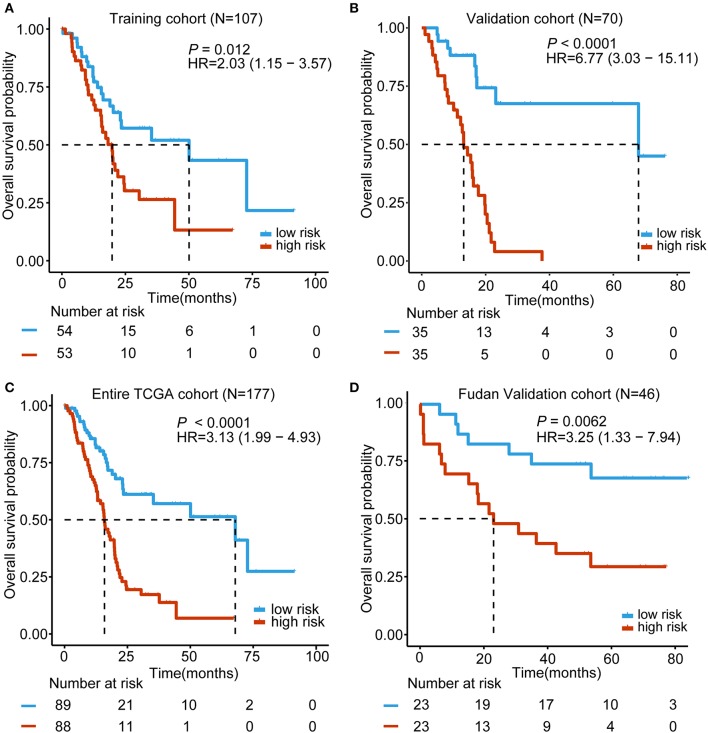
Figure 2.
Kaplan–Meier analyses of the overall survival (OS) based on the 5-lncRNA signature. (A) TCGA training cohort (N = 107); (B) TCGA validation cohort (N = 70); (C) Entire TCGA cohort (combined training and validation patients, N = 177); (D) Fudan validation cohort (N = 46). The tick marks on the Kaplan–Meier curves represent the censored subjects. The differences between the two curves were determined by the two-side log-rank test. The number of patients at risk is listed below the survival curves.

