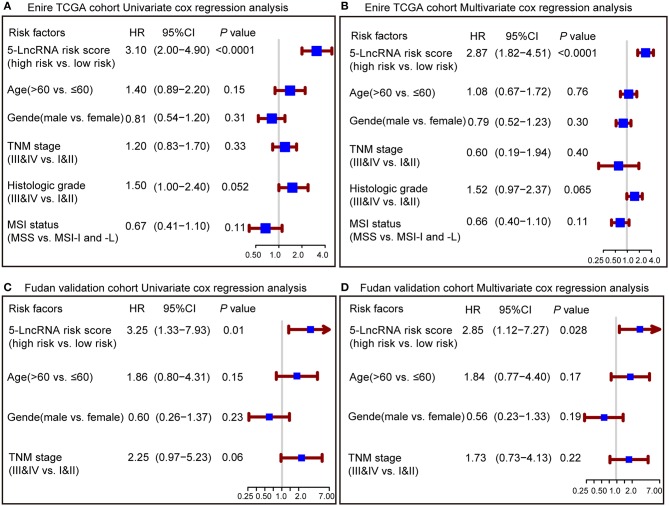
Figure 3.
Forest plot summary of analyses of overall survival (OS). Univariate and multivariate analyses based on the 5-lncRNA signature and clinical covariates in the entire TCGA cohort (A,B) and Fudan validation cohort (C,D). The blue solid squares represent the hazard ratio (HR), and the red transverse lines represent 95% confidence intervals (CI). All P-values were calculated using Cox regression hazards analysis.

