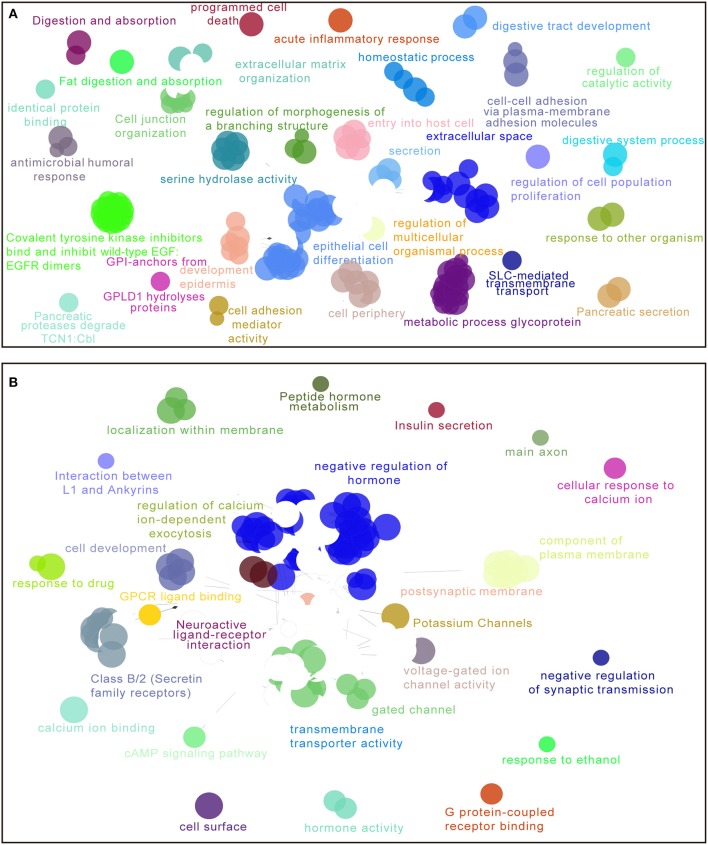
Figure 6.
Enriched functions and pathways of the top 1,000 significantly differentially expressed genes (DEGs) in high vs. low risk PDAC patients in the TCGA dataset. The interaction network was generated with the Cytoscape plug-in ClueGO and CluePedia. Functions and pathways of up-regulated DEGs (A), down-regulated DEGs (B). The size of the nodes shows the term significance after Bonferroni correction. The significant term of each group is highlighted.

