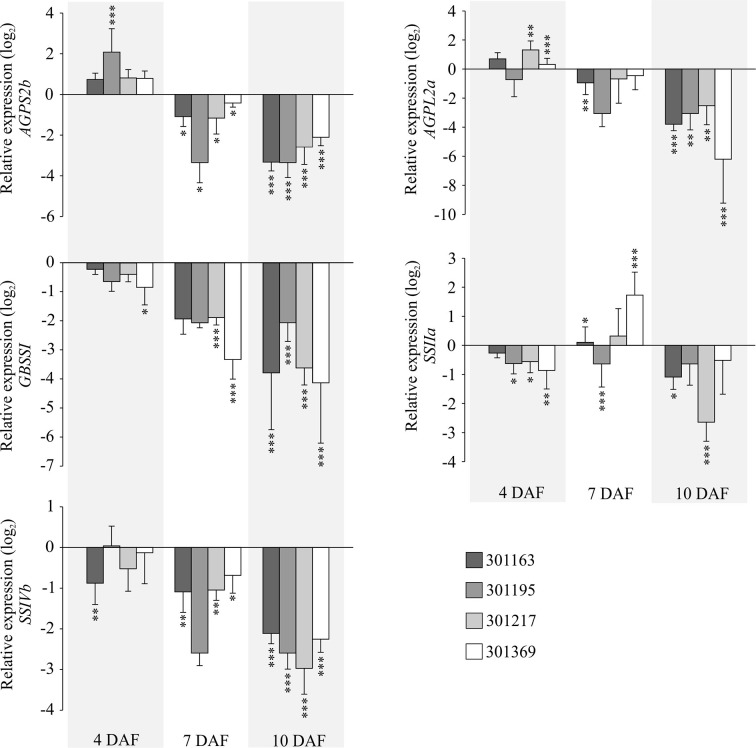
Figure 4.
Gene expression analysis of key starch biosynthesis enzymes under HNT. RT-qPCRs representing expression for selected genes related to starch biosynthesis in developing seeds (4, 7, and 10 DAF) corresponding to four genotypes. The relative expression values indicate ratio of HNT to control for the respective genotype and developmental timepoint. For statistics, paired t-test was used to compare expression levels for each gene under HNT relative to control for the respective genotype and developmental timepoint. Error bars indicate standard deviation from three biological and technical replicates. ***indicates p < 0.001 and **p < 0.01. DAF, days after fertilization; HNT, high night-time temperature.

