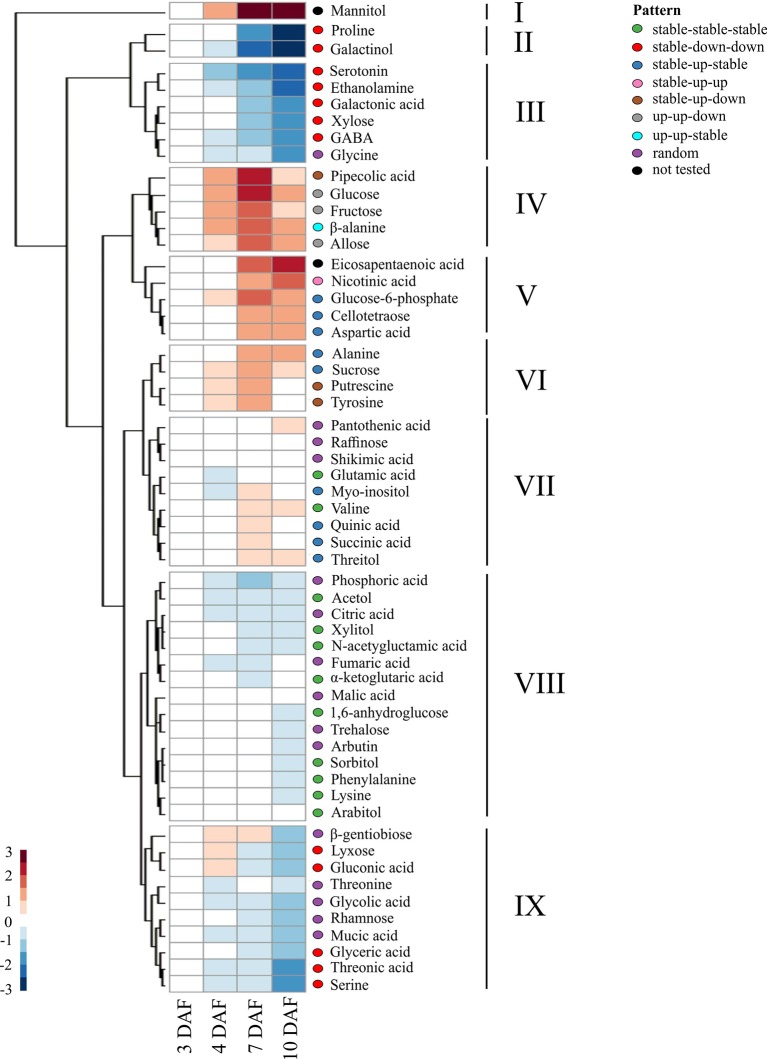
Figure 6.
Temporal trends in the levels of metabolites across early seed development. A heatmap showing the changes in levels of metabolites during the early seed development in the control condition. The ratio of the median of normalized peak area at each time point against the initial time point (3 DAF) was log2 transformed to calculate relative metabolite levels. Hierarchical clustering analysis was performed using Euclidean distance to group metabolites with similar temporal patterns. Directional patterns represent statistically significant changes in metabolite level relative to metabolite level at previous timepoint using generalized linear models, using a cutoff in adjusted p-value at 0.05 ( Table S3 ), which are represented by colored ellipses to the right of the heatmap.

