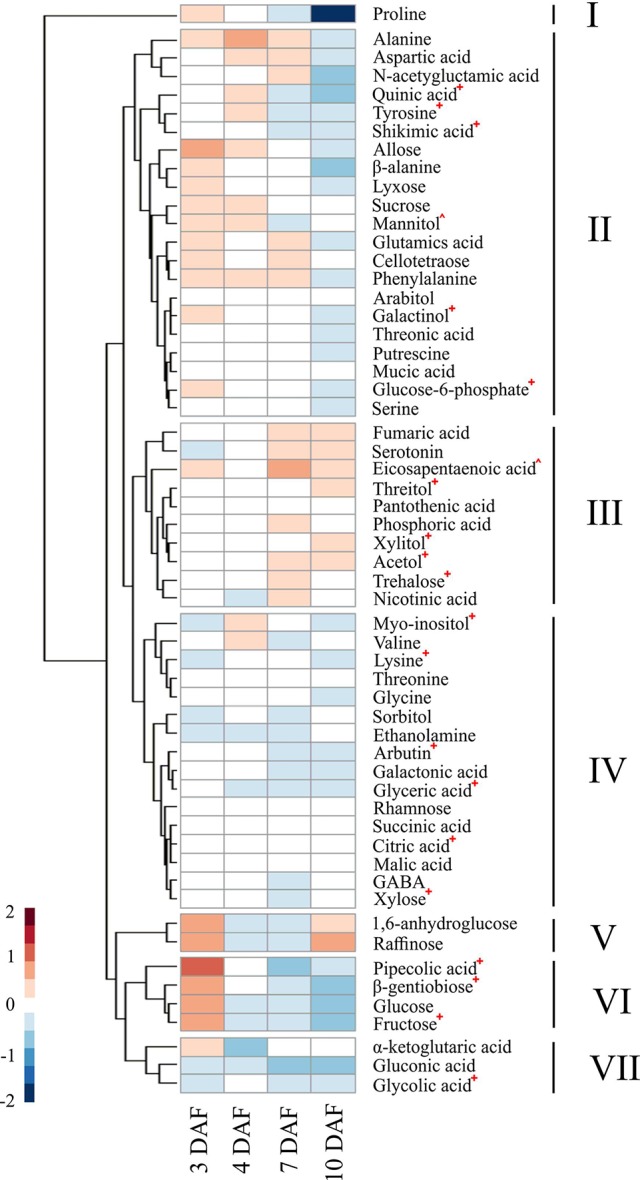
Figure 7.

Effects of high night-time temperature on the levels of metabolites across early seed development. A heatmap showing the effects of HNT on the levels of individual metabolites during the early seed development. The ratio of the median of normalized peak area under HNT against control conditions at each time point was log2 transformed to calculate relative metabolite levels. Hierarchical clustering analysis was performed using Euclidean distance to group metabolites similarly affected by HNT treatment. Statistically significant difference in metabolite levels between HNT and control conditions was determined by meta-analysis, using a cutoff in adjusted p-value at 0.05 ( Table S4 ) and was denoted by a +, ^ indicates a metabolite which was not statistically tested due to inconsistency among genotypes. HNT, high night-time temperature.
