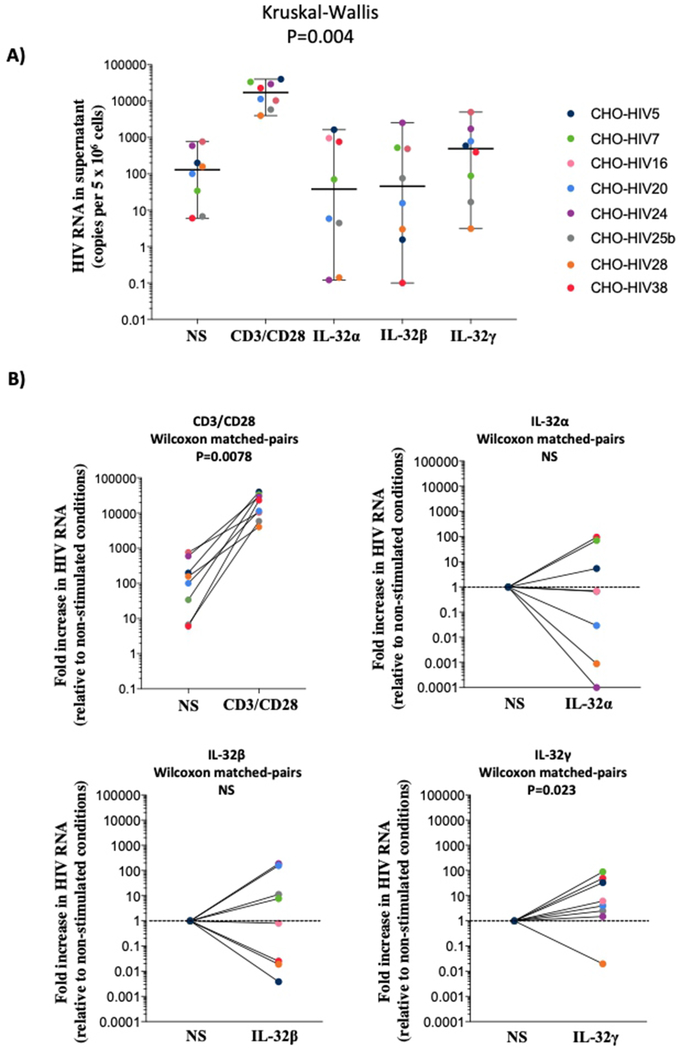
Figure 5: HIV-1 production in CD4+ T-cells from HIV-1+ cART-treated aviremic individuals (n=8) in response to IL-32 isoforms.
Cells were activated with either Dynabeads Human T-expander CD3/CD28 at a concentration of 1 bead per cell (used as positive control for the efficacy of HIV-1 reactivation assay) or with IL-32 recombinant proteins (250-500ng/ml). A) HIV-1 RNA quantified by qRT-PCR from supernatant of CD4+ T-cells (expressed as HIV-1 copies per 5 x 10⁶ treated or untreated cells) at day 6 post stimulation. NS represents non-stimulated control cells from the same individuals. B) Matched pair analyses for cells from the same individual shown in A, stimulated with TCR (upper left panel), IL-32α (upper right panel), IL-32β (lower left panel) and IL-32γ (lower right panel) relative to non-stimulated (NS) cells. Data were analyzed by the non-parametric Kruskal-Wallis for multiple comparisons in A and matched pair analysis was done by Wilcoxon test in B.

