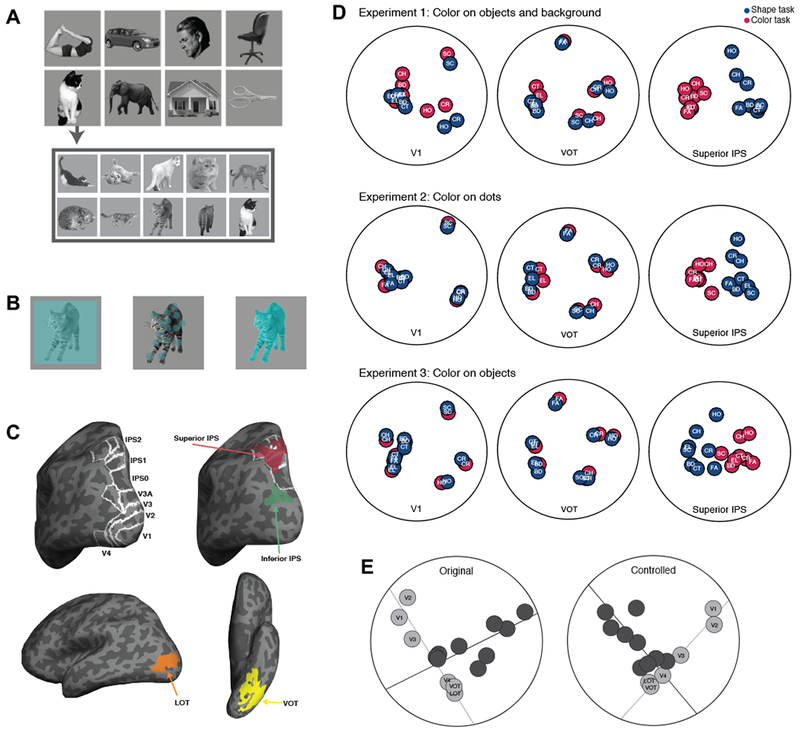
Figure 1.

Stimuli, regions of interest (ROIs) and previous findings. A. Example stimuli used in the experiments. The same 10 distinctive exemplars from 8 object categories were used in each of the three experiments. B. The relationship between the shape and color features in each experiment. In Experiment 1, color appeared over the entire image square such that both the objects and the background were colored (leftmost image). In Experiment 2, color appeared on a set of dots superimposed on the objects and shared a similar spatial envelope with the objects (middle image). In Experiment 3, color appeared on the objects only (rightmost image). C. Inflated brain surface from a representative participant showing the ROIs examined: topographic ROIs in OTC and PPC, superior IPS and inferior IPS ROIs, with white outlines showing the overlap between these two PPC ROIs and PPC topographic ROIs, and LOT and VOT ROIs. D. Category representational structures across the two tasks in V1, VOT and superior IPS for Experiments 1-3 as reported in Vaziri-Pashkam and Xu (2017). Using the pairwise decoding accuracy for each pair of object categories as input, we performed a MDS analysis and projected the similarity between each pair of object categories as the distance on a 2D surface. Each colored circle denotes an object category in a task, with blue circles representing those in the shape task and the red ones those in the color task. BD: body, CT: cat, CH: chair, CR: car, EL: elephant, FA: face, HO: house, and SC: scissors. E. A two-pathway separation of visual information representation in OTC and PPC regions as reported in Vaziri-Pashkam and Xu (2019). Here participants viewed uncolored exemplars from the same 8 object categories as those shown in Figure 1A and performed a 1-back object repetition detection task. The exemplars were either shown unedited (original) or with contrast, luminance and spatial frequency equalized (controlled). Using pairwise object decoding accuracy, we constructed a category-wise similarity matrix for each ROI. We then correlated these matrices across ROIs to construct a region-wise similarity matrix. Using MDS, we projected the ROIs onto a 2D surface with the distances between the ROIs reflecting the similarities in their object category representational similarity. For both the original (left panel) and controlled (right panel) images viewed, we saw the emergence of a two-pathway structure in the representational space, with OTC regions lining up hierarchically along an OTC pathway and PPC regions lining up hierarchically along an orthogonal PPC pathway. A total least square regression line through the OTC regions (the light gray line) and another through the PPC regions (the dark gray line) were able to account for 79% and 61% of the total amount of variance of the region-wise differences in visual object representation for the original and the controlled object images, respectively. Figures used here are modified from those appeared in Vaziri-Pashkam and Xu (2017) and Vaziri-Pashkam and Xu (2019).
