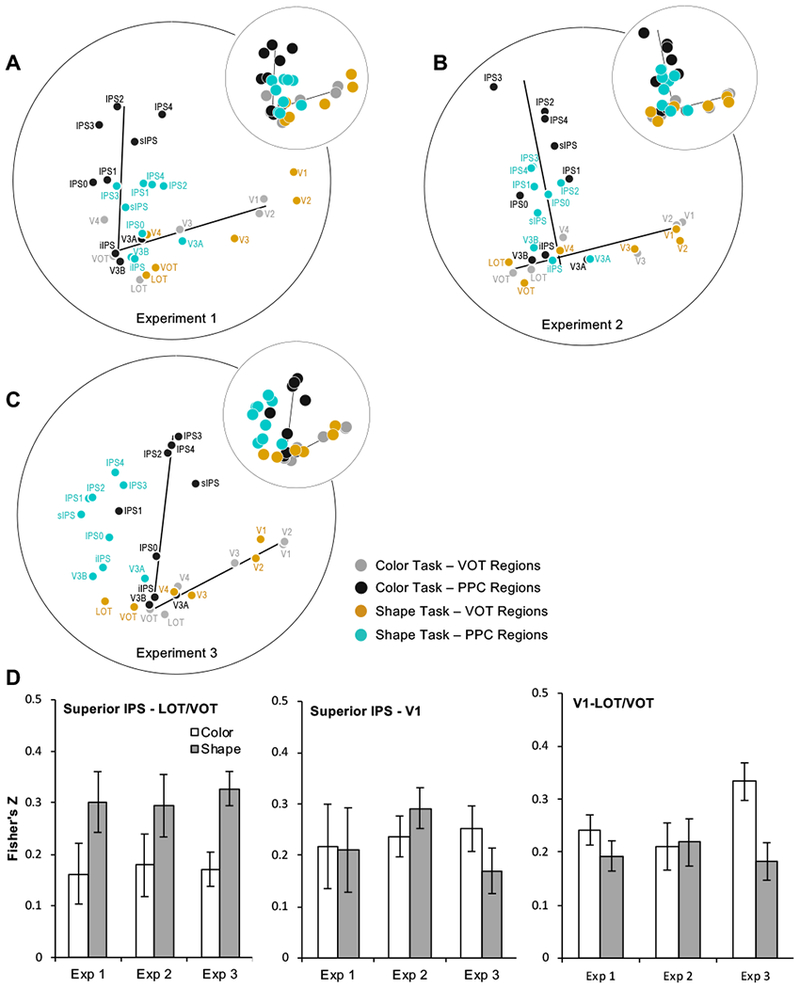
Figure 2.

The representational structures for all the ROIs examined in the two tasks for A. Experiment 1, B. Experiment 2, and C. Experiment 3. The larger plots show the brain regions with their names labeled. The small insert at the top right of each large plot provides a cleaner view of the shift of brain regions across the two attentional tasks. Although the OTC pathway had a similar extent and overlapped between the two attentional tasks, the PPC pathway was compressed towards the OTC pathway when shape, rather than color, was attended. D. Fisher’s z-transformed correlation coefficients for superior IPS–LOT/VOT, superior IPS–V1, and V1–LOT/VOT object representational structure correlations across the two attentional tasks in the three experiments. Consistent with the observations made from the MDS plots (A to C), object representational structures were more correlated between superior IPS and LOT/VOT when shapes were attended than when they were not. Such an effect was not found in the superior IPS–V1 or the V1–LOT/VOT correlation. Error bars indicate within subject errors.
