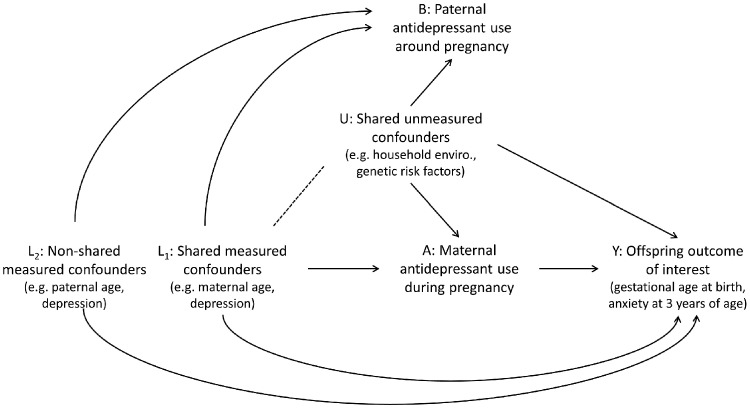
Figure 1.
Causal diagram. Adapted with permission from Wolters Kluwer Health, Inc.: Lipsitch M, Tchetgen Tchetgen E, Cohen T. Negative controls: a tool for detecting confounding and bias in observational studies. Epidemiology 2010;21:38388. https://journals.lww.com/epidem.

