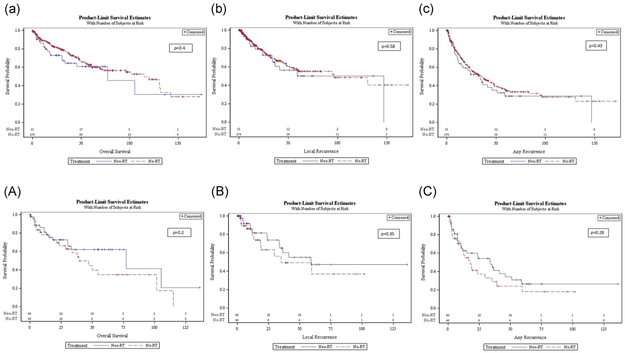
FIGURE 1.
Unadjusted (lower case) and propensity score matched (capital), OS (a, A), LR rate (b, B), and RFS (c, C) Kaplan-Meier curves for the neoadjuvant (blue line) vs no radiation (red line) groups. LR, local recurrence; OS, overall survival; RFS, recurrence-free survival [Color figure can be viewed at wileyonlinelibrary.com]

