
Table 2.
Structures of 1–12 and the IC50 values for inhibition of proliferation of transporter null (R2), FRα (RT16), PCFT (R2/PCFT4), and RFC (PC43–10)-expressing CHO cells, and KB human tumor cells (expresses FRα, RFC, and PCFT) in culture. Results are expressed as mean values (± standard errors) from 3–10 experiments. Abbreviations: MTX, methotrexate; PMX, pemetrexed; RTX, raltitrexed.
 | |||||||
|---|---|---|---|---|---|---|---|
| Compound | X | IC50 (nM) | Reference | ||||
| PC43–10 (RFC) | R2 | RT16 (FRα) | R2/PCFT4 (PCFT) | KB (FRα/RFC/PCFT) | |||
| 1* | - | 304 (89) | 448 (78) | 4.1(1.6) | 23.0(3.3) | 1.7(0.4) | 46 |
| 7 |  |
>1000 | >1000 | 1.4(0.24) | 48.60(16.40) | 1.40(0.24) | - |
| 8 |  |
>1000 | >1000 | 1.78 (0.17) | 747 (156) | 6.36 (1.00) | - |
| 12 |  |
>1000 | >1000 | >1000 | >1000 | 669 (112) | - |
| 3 | - | 101.0 (16.6) | 273.0(49.1) | 0.31 (0.14) | 3.34 (0.26) | 0.26 (0.03) | 25 |
| 9 |  |
>1000 | >1000 | 7.78(1.63) | >1000 | 4.23(0.57) | - |
| 4* | - | 189(51) | 290((8) | 0.61(0.11) | 6.51(1.30) | 0.09(0.02) | 34 |
| 10 | 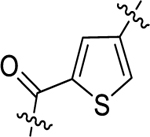 |
>1000 | >1000 | >1000 | >1000 | >1000 | - |
| 5* | - | 197(49) | 355(10) | 0.33(0.15) | 5.39(1.27) | 0.17(0.05) | 34 |
| 11 |  |
>1000 | >1000 | 867(147) | >1000 | 69.8(16.1) | - |
| MTX* | - | 12(1.1) | 216(8.7) | 114(31) | 121(17) | 6.0(0.6) | - |
| PMX* | - | 138(13) | 894(93) | 42(9) | 13.292.4) | 68(12) | - |
| RTX* | - | 6.3(1.3) | >1000 | 15(5) | 99.5(11.4) | 5.9(2.2) | - |
*
These data were previously published (see reference).