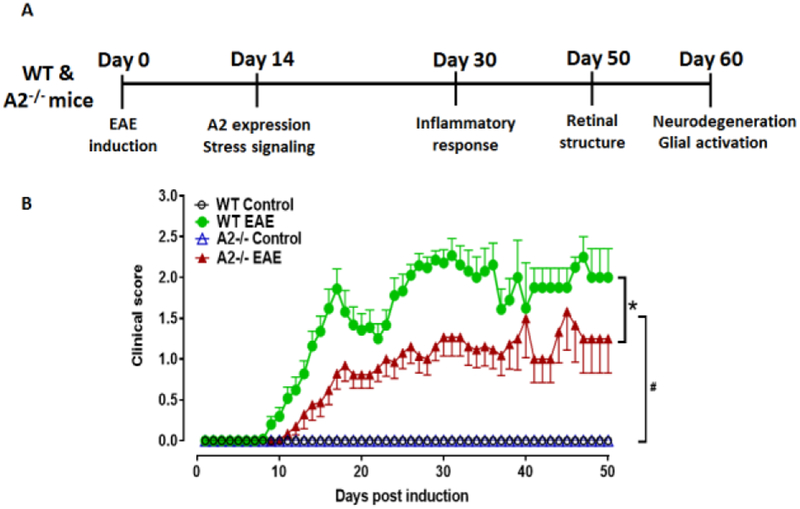
Figure 1: EAE induction and evaluation of clinical scores.
A) Schematic representation of the time points of EAE induction and experiments performed. B) Animals were evaluated every day and the clinical scores were recorded according to a 0–5 scale (see methods section for details). WT EAE mice showed progressively increasing clinical score starting at day 9. A2−/− EAE mice showed significantly lower clinical score as compared to WT EAE mice. Both control groups showed no signs of motor deficits. *p<0.05, A2−/− EAE vs WT EAE for days 11-21, 24-37, 41-43 and 47. #p<0.05, WT and A2−/− EAE groups vs respective control groups starting at days 11 and 14 respectively, and till the end of the experiment. N = 17-26 per group. Four animals in WT EAE and two in A2 −/− EAE group died or were sacrificed due to weight loss. Data are presented as mean ± SEM.

