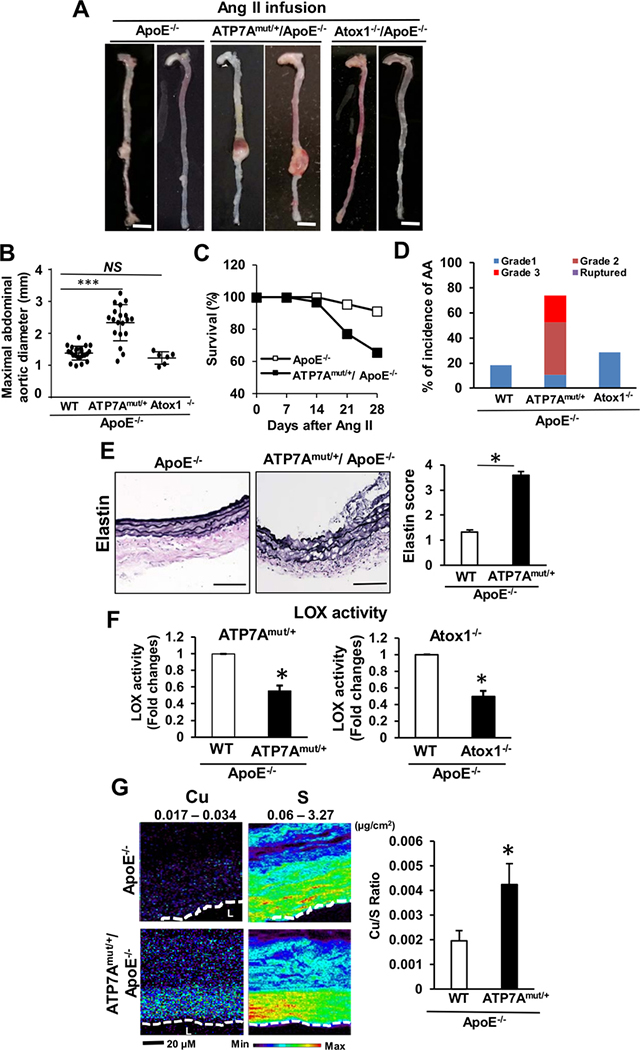
Figure 2. ATP7A dysfunction, but not lack of Atox1, augments AAA formation.
(A-F) ApoE−/−, ATP7Amut/+/ApoE−/− or Atox1−/−/ApoE−/− mice following 4 weeks of Ang II infusion without HFD were examined. A, Representative images of whole aorta. Scale bars: 3 mm. B and C, Maximal abdominal aortic diameter (B), Kaplan–Meier curves of survival (C) in ApoE−/− (n=23), ATP7Amut/+/ApoE−/− (n=19) and Atox1−/−/ApoE−/− (n=6) mice. D, Incidence and severity of AA. See the Online Methods for grading aneurysm severity. E, Representative images of elastin integrity of abdominal aortic sections from ApoE−/− (n=23) and ATP7Amut/+/ApoE−/− (n=21) mice and quantitative analysis of grading for elastin degradation. Scale bars: 20 μm. F, LOX activity in aortic tissue. n=4. G, Aortic Cu content in ApoE−/− or ATP7Amut/+/ApoE−/− mice following 4 weeks of Ang II infusion as measured by synchrotron-based x-ray fluorescence (XFM). XFM scans (1–2 seconds per pixel) were performed in paraffin-embedded tissues. The maximum and minimum threshold values in microgram per square centimeter are given above each frame. Map of Cu shows areas of the lowest to the highest content scaled to a rainbow color (bottom). Total sulfur is used as a surrogate for total cellular protein and to visualize the morphology of tissue sections. n=5. *p<0.05, ***p<0.001.

