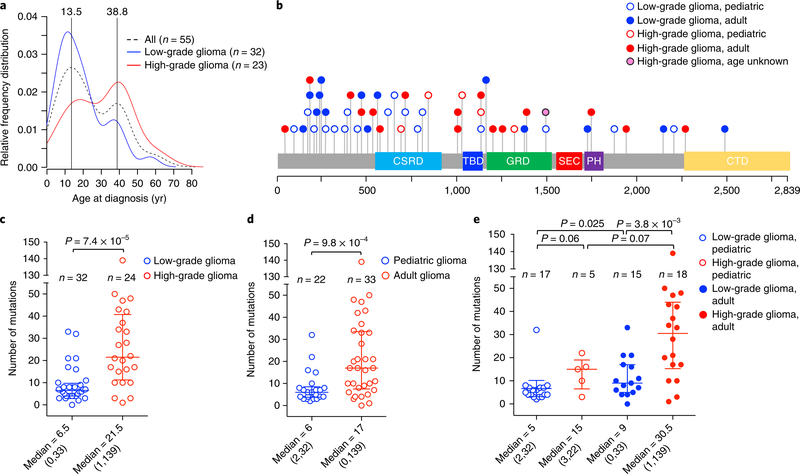
Fig. 1 |. Analysis of germline and somatic mutations in NF1-glioma patients.
a, The relative frequency distribution of age at diagnosis is represented by density plot: the overall distribution of NF1-glioma patients (dashed black line, n = 55) by age identifies two peaks, 13.5 and 38.8 years. Low-grade gliomas (blue line, n = 32) occur more frequently in children, while high-grade gliomas (red line, n = 23) are diagnosed more frequently in adults. b, Germline mutations in the NF1 gene identified in NFI-glioma patients by WES. The spectrum of NF1 germline variants (SNVs and indels) is represented with each mutation shown only once per patient. We identified NF1 germline pathogenic mutation in 51 of 56 (91%) patients. Patients no. 47 and no. 52 had one additional pathogenic germline mutation. c, Scatter plot showing the number of somatic mutations (SNVs and indels) occurring in low-grade and high-grade NFI-glioma (low-grade glioma, n = 32; high-grade glioma, n = 24; P = 7.4×10⁻⁵, two-sided Mann-Whitney-Wilcoxon (MWW) test). d, Scatter plot showing the number of somatic mutations occurring in patients younger than 16 years (pediatric, n = 22) or older than 18 years (adult, n = 33; P = 9.8×10⁻⁴, two-sided MWW test). Mutations in the patient of unknown age were not included in the analysis. e, Scatter plot showing the number of mutations according to grade and age (low-grade glioma, pediatric, n = 17; high-grade glioma, pediatric, n = 5; low-grade glioma, adult, n = 15; high-grade glioma, adult, n = 18). Mutations in the patient of unknown age were not included in the analysis. P = 3.8×10⁻³, high-grade versus low-grade adult gliomas; P = 0.025, adult versus pediatric low-grade gliomas; P = 0.06, low-grade versus high-grade pediatric gliomas; P = 0.07, pediatric versus adult high-grade gliomas (two-sided MWW test). Scatter plots show median and interquartile range. Median and range of mutations are reported below each plot.

