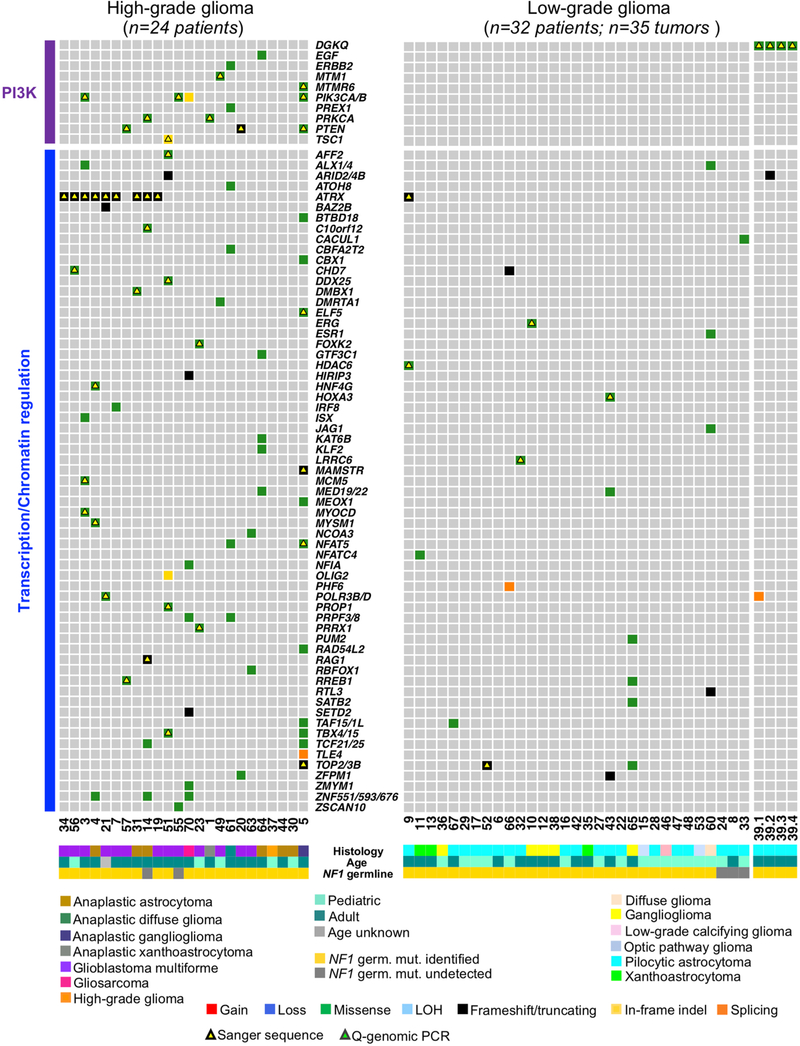
Extended Data Fig. 9 |. Somatic alterations in PI3K and Transcription/Chromatin regulation pathways in NF1-glioma.
Integrated matrix of 59 NF1-glioma samples (56 patients) and somatic alterations (SNVs and indels, and significant copy number variations) occurring in genes linked to PI3K and transcription/chromatin regulation pathways (left panel, high-grade glioma; right panels low-grade glioma). Rows and columns represent genes and tumor samples, respectively. NF1-glioma samples are sorted in the same order of Fig. 2. Genes are grouped by PI3K (purple) and transcription/chromatin regulation (blue) pathways. Genomic alterations, age, the histology of glioma and the identification of NF1 germline mutation are shown by the indicated colors. Validation by Sanger sequencing (SNVs) and quantitative-genomic PCR (gains and losses) are indicated by yellow and green triangles, respectively.

