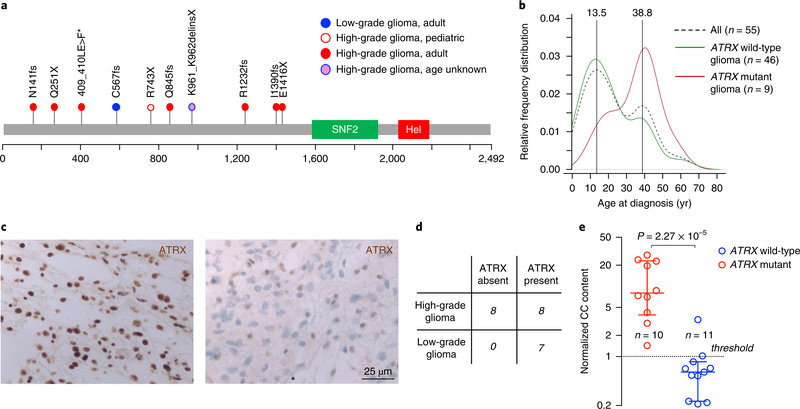
Fig. 3 |. Analysis of ATRX somatic mutations in NF1-glioma patients.
a, ATRX mutations were identified by WES. The spectrum of ATRX somatic variants (SNVs and indels) is represented with each mutation shown only once per patient. We identified and validated by Sanger sequencing ATRX pathogenic mutations in 10 patients (1 low-grade glioma, 3%; 9 high-grade gliomas, 37.5%). b, The relative frequency of age distribution is represented for all patients (dashed black line, n = 55), ATRX wild-type (green line, n = 46), and ATRX mutant gliomas (red line, n = 9; for one patient carrying ATRX mutation age was unknown and was not included in the analysis). c, Microphotographs of ATRX immunohistochemistry in gliomas from NF1 patients. Representative images are from n = 7 low-grade gliomas (left) and n = 16 high-grade gliomas (right). Results were validated on more than ten independent samples to ensure the staining pattern on human tissue was reproducible. High-grade glioma samples were negative for ATRX expression whereas low-grade gliomas retained ATRX protein expression. d, Contingency table shows loss of ATRX protein expression in 8 of 16 high-grade and in none of 7 low-grade NF1-gliomas (P= 0.05, two-sided Fisher’s exact test). e, C-circle (CC) assay was performed to measure ALT activity in NF1-glioma samples. The scatter plot reports the normalized CC content for each glioma according to ATRX mutational status: ATRX wild-type (blue, n = 11) and ATRX mutant gliomas (red, n = 10). For each group the median with interquartile range is indicated. All ATRX mutant gliomas but only one ATRX wild-type glioma showed increased ALT activity (normalized CC content greater than 1; P = 2.3×10⁻⁵, two-sided MWW test).

